

“Which investors drove this selloff?”, JPMorgan’s Nikolaos Panigirtzoglou asks, following one of the most memorable routs for global equities in recent history.
While the impetus – the proximate cause, if you will – for the market’s consternation was the worsening of headlines around the COVID-19 outbreak, systematic selling likely magnified the losses. Regular readers are fully apprised of that reality.
For example, Panigirtzoglou’s colleague Marko Kolanovic estimated the total amount of selling pressure from options hedging, CTA deleveraging and vol.-targeter de-risking at around $150 billion on Monday and Tuesday of last week alone.

By the end of the week, deleveraging from vol.-targeters likely totaled nearly $90 billion, as detailed extensively in “All Bets Are Off“.
Panigirtzoglou underscores the notion that the virus scare simply exposed the market’s underlying vulnerabilities, tipping over crowded positioning and forcing unwinds in extreme exposure among key investor cohorts.
“CTAs have likely been at the core of the position reduction over the past week”, Panigirtzoglou says, noting that after rising to the highest levels since the January 2018, post-tax-cut melt-up, “the average z-score of the short and long lookback period momentum signals for the S&P 500 index… experienced a shift of 1.8 standard deviations in only one week”.
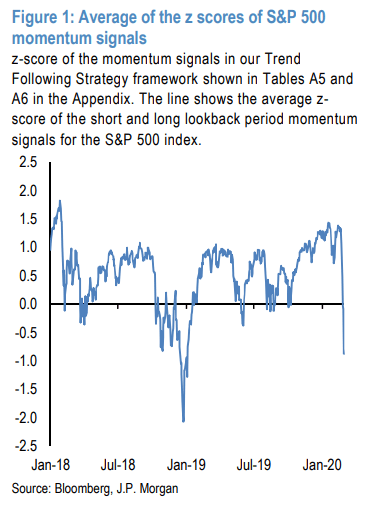
(JPMorgan)
What, exactly, does that entail in terms of total selling pressure?
Well, the CTA universe is around $350 billion in AUM, and, generally speaking, is leveraged around 4X, Panigirtzoglou reminds you. Using those assumptions, simple math dictates that these strategies can control more than $1 trillion worth of assets at any given time. Panigirtzoglou assumes that roughly 25% of that is dedicated to equities, on the way to suggesting that “moving from a pretty long equity position in mid-February to a pretty short equity position at the end of February, implies a negative flow impulse of $350 billion”.
To reiterate: That’s an estimate. But, as I wrote Friday, given the relentless decline which saw key level after key level breached, you can safely assume there was “more where that came from” (so to speak) after the $40-$60 billion worth of selling Kolanovic estimated for Monday-Tuesday.
As for Long/Short funds, Panigirtzoglou has consistently flagged their rising beta to equities since October (likely as that universe played catch-up to soaring benchmark indexes late last year and in January). He notes that because monthly data for February isn’t available yet, about all that can be said currently is that Equity Long/Short hedge funds “entered the past week’s correction in a vulnerable state”.
You might recall that another source of vulnerability for the market headed into last week was a massive asset manager long, which could have easily succumbed to profit-taking behavior.
“These positions had risen steeply over the past year, propelling the equity market during the course of 2019 and during the beginning of 2020”, Panigirtzoglou goes on to say, adding that as of mid-February, “these spec positions on US equity futures stood at even higher levels than at the beginning of 2018 [and although] there has been significant position reduction since, extrapolated observations based on open interest changes up until Feb 27th suggest that these positions are still far from the capitulation levels of December 2018”.
You’ll also note from the visual above that CTAs could potentially deleverage further to reach the extremes hit during the Q4 2018 rout. Similarly, the visual in the left pane below shows that although the quantity-on-loan in SPY has jumped sharply, it’s a ways from levels hit in December of 2018.

(JPMorgan)
As for the right pane, Panigirtzoglou reminds you that while retail investors dumped around $20 billion of equity funds over the past week, they “sold more than $70 billion in five straight weeks” during the dark days of December 2018, when fear gripped the market.
“Could heavy losses and fears of recession induce retail investors to sell even more equity funds as they did [then]?”, Panigirtzoglou wonders.
Perhaps the two most important points he makes (at least from a kind of 30,000-foot, market structure perspective) are related to the self-feeding nature of what happened last week and, in the same vein, how a dearth of liquidity likely made things worse.
On the liquidity point, the following visual just shows you the average number of contracts at the tightest bid/ask in E-minis.

(JPMorgan)
As you can clearly see over there on the far right-hand side, this simple measure of market depth fell rapidly to near record lows, in line with December 2018. What stands out the most about that visual, though, is that market depth has never recovered from “Vol-pocalypse.”
When it comes to how and why modern swoons sometimes seem to “snowball” and “cascade”, Panigirtzoglou writes of CTAs that “momentum traders were caught with very long US equity futures positions into the correction and were forced to unwind these positions abruptly, propagating their own negative momentum“.
That, folks, is how things go awry.
Volatility is the toggle switch on which all of this turns. On the market-making side, many business models were “calibrated during the years of low volatility” (to quote Kolanovic’s 2018 “Risks of Market ‘Uberization'” note). Volatility is inversely correlated with market depth. The thinner the market, the more price impact a given sell flow will have. The larger the swings, the more likely it is that key levels associated with CTA trend models will be breached, leading to more mechanical selling.
Sometimes, that entire edifice simply implodes.


Your articles well document the net sellers, but I wonder who the net buyers were. Even on a sharply down week there are as many buyers as sellers. Excuse my ignorance, but I’m curious who the net buyers were. Knowing who they were (and their possible resilience) would help me understand the dynamics better .
Great question!
I am only guessing on net buyers but I would guess asset allocators -re-balancing, insurance cos, corps buying back stocks, shorts covering, really fast money, hedging of puts or selling/monetizing them causing the other side to reduce their hedge, possibly wealth mgmt, those underweight equities to get closer to benchmarks and probably foreign investment firms and sovereign wealth funds that have longer time horizons and lack high quality and growth and see them possibly on sale.
Very few in most professional firms are willing to stick their neck out in any size until the bounce is well established (too much career risk and a big problem in money mgmt) so I am guessing the above.
Always a great question. Wish I had a good solid answer but I think the above might be thought provoking to some degree.
Be smart and use your advantages to outperform. Good luck.
H-Man, timely written piece as the virus continues to expand. That dead cat bounce everyone was looking for on Monday might just be a dead cat.
Brings to mind fond literary memories of GFC. Remember “We are all subprime now”? and “We have achieved containment (in low-earth orbit)”.
Perhaps you’ve nailed the meme for this round: “we are all dead cats now”. 😉