

Hiring accelerated across the world’s largest economy last month, the most important US jobs report since the one before it showed.
By Friday, traders were bracing for an upside “surprise.” I’m not sure how “surprising” something can be if you’re expecting it, but… well, I won’t litigate the myriad contradictions of marketspeak and trader vernacular here.
Officially, consensus for the NFP headline was 175,000 headed in, but the “whisper” was ~190,000. The actual print, 216,000, thus constituted a large beat. The range of guesses (and I’m out of economist jokes on Friday) was 80,000 to 235,000.

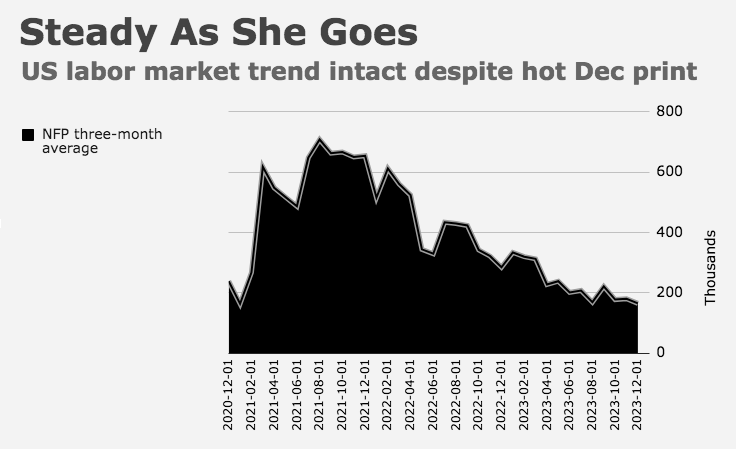
Revisions lopped 71,000 from the prior two months, not enough to take the edge off what certainly counted as a hot print, but enough to keep the three-month average from rising.
Private payrolls rose 164,000, exactly in line with ADP. Consensus there was 130,000. The range was 60,000 to 188,000.
Gains were again concentrated in government and health care. Construction added jobs as well, so did leisure and hospitality, although additions there are running at just half the pace seen in 2022. Note that leisure and hospitality has now recouped nearly all of the jobs lost to the pandemic — employment in the sector is just 1% below February 2020 levels.
Average hourly earnings came in warm. The 0.4% MoM gain topped estimates, and the YoY increase, 4.1%, was likewise hotter-than-expected.
If you wanted to (and markets almost surely will), you could spin a hawkish narrative using the headline NFP beat and the warm read on pay growth. Many observers (Fed officials among them) argued that rate-cut pricing for 2024 was too aggressive versus the incoming data. The NFP headline and AHE prints will underscore the point.
The household survey came with annual revisions. There was no material change to the unemployment rates for the first 11 months of 2023. The jobless rate stuck at 3.7%. in December.
Notably, participation dropped three tenths, to 62.5%.

As the figure shows, that was the largest drop since January of 2021 and before that, April of 2020, during the initial COVID jobs apocalypse.
Household employment posted an “impressive” 683,000 drop.

That was likewise the largest decline since “bridge liquidity” (Steve Mnuchin’s term for the various measures and facilities the government adopted and created to mitigate the impact of the original pandemic lockdowns on businesses and workers).
Overall, this was a noisy release. As noted, markets’ natural inclination will be to trade the hot headline and the AHE overshoot. Bets on Fed cuts will likely be trimmed further.
But I’d suggest the release admitted of more than a little ambiguity. A “clean” read wasn’t readily ascertainable, although economists who’ve been wrong for two years straight (so, most economists) will surely endeavor to extract something definitive from this Jackson Pollock-style splatter of numbers.
At the least, we can say the case for a March rate cut, to the extent there was such a case, is now less convincing.
For all the overwrought, futile divination that went on Friday, the three-month NFP average is still drifting lower, and now sits at 165,000.


This is a total waste of time. Parsing this report, I mean. Seriously. You’re better off having a picnic or, I don’t know, going for a nice jog in the crisp winter air. It’s just God awful that we pay people eight times the median national income to sit around and parse a statistical release that argues with itself and is subject to so many revisions and methodological tweaks as to be completely impenetrable at best and totally meaningless at worst.
In the spirit of Rush Limbaugh ….. DITTO!
Trying to find order in chaos.
My main goal in 2024 is trying to time some relatively small sales of SPY because I am going to need a little more cash. I prefer to sell at the high vs. the low 🙂
n.b. I want to note my appreciation for the chart annotations you added, spelling out the revisions & est./act. numbers. It definitely adds value.
Noisy data -> focus on 3MMA.
The part of the jobs report that puzzles me the most is the household survey. The markets don’t seem to react to it, economists/analysts don’t do much with it either, and it deviates so much from the payroll data (establishment survey). Other than a sort of demographic overlay on the payroll data, and the basis of various doomer hypotheses, what can one draw from it?
I’ve also been wondering about the declining response rate to this sort of survey, and if there’s some way to improve it. Pay respondents? Supplement with IRS data?
In the late 1960s my wife was a senior statistician for the Ohio Dept of Labor stuff. Her job was to provide the monthly estimates of employment, unemployment, average wages and other such tidbits of data for the non-profit/gov sectors and for the small business sector of the state’s economy which, of course, fed into the national data. I’d share a couple of things. She and her colleagues were actually very good at this. The Ohio department won plaudits from Washington for the quality of its work. The process, however, was flawed in a way that resisted change. The main problem was that the equations used to extrapolate outcomes from survey inputs were out-of-date because the coefficients applied to various factor variables were regularly rendered obsolete as a result of structural changes in the economy. This was a problem then and still is today for all the agencies that produce output derived from estimates based on data sampling for such variables as prices, economic output, etc. Then, as today, getting critical inputs through sampling is very difficult. Owners and managers of agencies, as well as senior managers, generally don’t like sharing their data, especially monthly. A senior manager I knew said he had a rule about surveys from the government. He simply threw them all away when first received. The second time he got one he threw that away as well. He continued this practice until a survey came by registered mail he had to sign for. Then he would make sure it got answered and returned. Probably an exaggeration, but my wife assured me that it wasn’t far wrong. She spent an endless part of her days chasing down delinquent surveys. Because who responds and who doesn’t is randomly variable in a given period and because the potential for error in the data isn’t insignificant, surveys are at least less than 100% reliable. In her years on the job, my wife and her colleagues tried many avenues for fixing these issues without success.
Hmm, I know someone at the BEA who does this stuff. Maybe he’ll chat with me.
Any perspective on the birth-death thing? That is also a puzzlement to me.
Good question. It must be yet another “assumed coefficient”?
Resurecting the discussion, an email from Natixis touched on some of the same issues:
Speaking of head fakes, there’s plenty of reason to be skeptical of the data that came out in this release.
o Seasonal factors have continued to wreak havoc with data in the wake of the pandemic.
? And when looking at non-seasonally adjusted data, this print doesn’t stand out in either direction much at all.
? Seasonals may still be doing their thing and distorting some of the data.
o And it’s not just seasonals creating noise – the trend of declining response rates continues.
? The response rate on the Establishment Survey dropped to just 49.4%, matching the rate from November 2022 which created a massive head fake in average hourly earnings that was reversed the following month.
? Keep an eye out for meaningful revisions next month…
Here ya go, data wonks. Is Uncle Milty growling?
https://finance.yahoo.com/news/u-money-supply-hasnt-done-100600021.html