

Did you hear? The stock rally died mid-week.
If it has a Lazarus moment, don’t be too surprised. ‘Tis the season for miracles, after all.
Plainly, US equities didn’t sell off on December 20 for fundamental reasons. Reading the real-time commentary during Wednesday’s “crash” (note the scare quotes) was nails on a chalkboard.
For one thing, it wasn’t a “crash.” Whenever the range of daily outcomes compresses such that people forget what a real selloff looks like, a 1% move to the downside, whenever it finally comes along, is invariably accompanied by a breathless recitation of synonyms for “disaster.” (Note the sarcasm on display in the figure below.)

December 20 was the first down move in excess of 1% since late October. Think about it: If you’re a month old right now, you’ve never witnessed a selloff of that magnitude in your entire lifetime.
Initially, observers speculated that the stumble might’ve been indicative of rally “exhaustion,” a hopelessly generic excuse that became wholly implausible within half an hour.
As the simplest of simple charts (i.e., an intraday SPX chart) makes abundantly clear, the explanation for the afternoon swoon on December 20 was almost surely technical and flows-related. Eventually, a smattering of color showed up on the terminal to that effect, but not before (and not to the exclusion of) belabored editorializing aimed at extracting deeper meaning.

I implore you to internalize this message: Everyone didn’t just decide, at 2:00 in the afternoon in New York, to sell on a sudden, market-wide realization that the rally had run too far. No, what you see in that chart is modern markets being “efficient.”
If you went over to “X,” where the community formerly known as “Finance Twitter” now has carte blanche to indulge their worst impulses thanks to new platform management, you could find some decent color on the likely actual cause of the downdraft: Options-related hedging tied to 0DTEs.
To his credit, Cameron Crise did pick up on what was actually going on. About 15 minutes after the closing bell on Wednesday, he wrote that although “the sudden drop in the stock market may be a little surprising and concerning, it doesn’t look like a real liquidation of positions in individual stocks.” Instead, he said, a thin, pre-holiday market probably wasn’t deep enough to readily absorb futures sell flow around 0DTE puts.
On Thursday morning, after Bloomberg published a click-friendly postmortem called “Vilified Zero-Day Options Blamed by Traders for S&P Decline,” Crise (who blogs on the terminal for Bloomberg, if you’re unfamiliar) was back with more. “Large flow in same-day expiry puts and the consequent delta-hedging dynamic seem largely to blame for the swoon,” he wrote, adding that equities were anyway “cruisin’ for a bruisin’” (cringe) given an SPX RSI in excess of 82 at Tuesday’s close. That, Cameron remarked, “was the highest reading since January of 2018, a period that immediately preceded the Volmageddon episode.”
That’s a useful parallel, not necessarily because 0DTEs raise the risk of a Volmageddon-like market event (although some do worry about that), but rather because the last time equities staged a low-vol, late-year melt-up that took stocks through some year-ahead price targets in December and January (i.e., 11 months early) was in late-2017/early-2018.
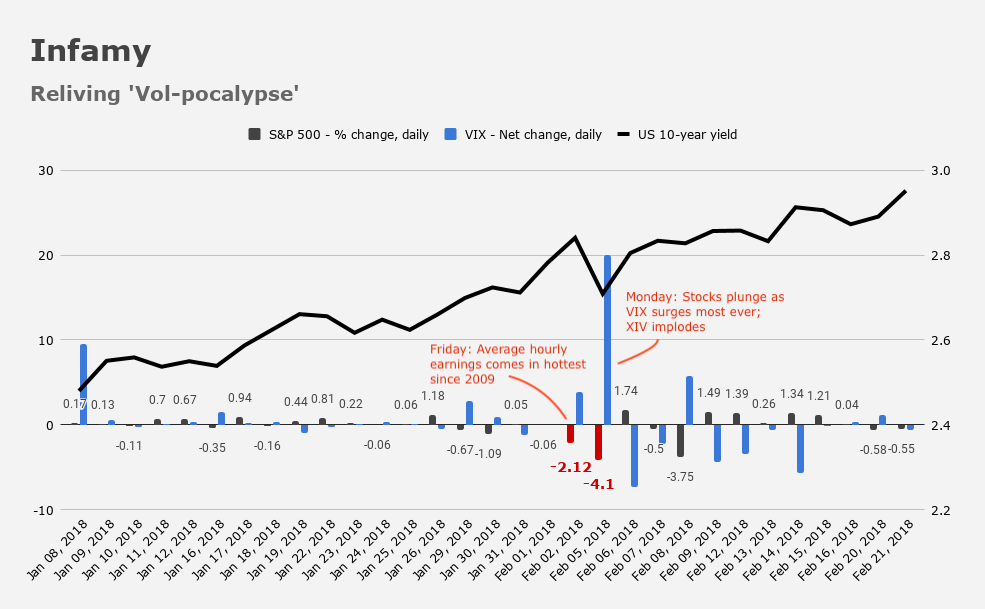
That period marked the end of the Yellen low-vol bubble. Volmageddon occurred on Jerome Powell’s very first day as Fed Chair, and the market historians among you will recall that it was a hot average hourly earnings print accompanying January NFP that tipped the dominoes. The following Monday, popular VIX ETNs went extinct.
Coming quickly back to the present day and 0DTEs, it’s worth noting that in addition to exacerbating drawdowns, they can insulate markets too. That can feel fortuitous, but these instruments’ growing influence is cause for concern from the perspective of anyone who believes markets don’t need to be any more of a casino than they already are.
0DTEs can account for a majority of overall S&P options volume, and the dealer intraday hedging can be very impactful.

The figures above give you a sense of the trend. Whether that’s a desirable state of affairs is debatable, to put it politely.
In 2022, it became apparent that day-trading in very short-dated options wasn’t the sole purview of small investors. Vol traders at some of the “largest funds on the Street” were likewise rolling the dice in 0DTEs, one popular derivatives strategist noted, in an eye-opening October 2022 note profiled here.
“The main driver of the volume growth is not retail investors, contrary to popular belief,” JPMorgan’s Marko Kolanovic and Bram Kaplan wrote, in their year-ahead 2024 derivatives outlook. On the bank’s estimates, just 5-6% of the 0DTE option flow is retail.

“We believe the 0DTE market is dominated by algorithmic and high frequency traders,” Kolanovic and Kaplan added.
To be fair, there are regulatory-/risk-management arb opportunities in 0DTEs, and I suppose you could argue they do serve a purpose for “hedging short-term risk,” as Bloomberg euphemistically put it, in the linked article mentioned above.
Still (i.e., even accounting for “legitimate” use cases and while acknowledging the outsized, and ostensibly comforting, presence of sophisticated market participants) some continue to express concern about the tail risks associated with these instruments. With that in mind, I’ll leave you with two short excerpts from the same 2024 outlook piece penned by Kolanovic.
Via JPMorgan:
By examining transactional level data, we estimate that these market participants are on balance net sellers of options. Although the imbalance is small (2-3% of total volume), due to the large gross gamma traded (averaging $440Bn daily), the resulting net gamma imbalance is still material. However, we estimate that 94% of these options are unwound or netted off before maturity, and therefore the impacts are largely confined to intraday hours. During normal market conditions, we observe some evidence of intraday volatility dampening, both in realized and implied, potentially due to market makers hedging their long gamma positions.
At the same time, we also point out that the volatility selling increases systemic tail risk. Again, due to the high gamma of 0DTE options, an exogenous shock which moves the market in a short period of time can lead to not only large losses to short sellers, but also leave them with unwanted delta positions. The potential forced unwinding of positions would have to take place in a market environment where market liquidity is still impaired from the pandemic. This could result in subsequent market moves that are far bigger than the initial exogenous shock, a situation akin to the 2018 ‘Volmageddon.’ Overall, the risk is still very much live and present.


I thought it would melt up or meltdown at the end of this expiry. The last sentence of the article was disconcerting.
“The potential forced unwinding of positions would have to take place in a market environment where market liquidity is still impaired from the pandemic.“
Good Lord, are we still blaming the pandemic for every exogenous shock that comes along?
They blamed the repo loan crisis ,that started in the fall of 2019, on the pandemic too.
Smoke & mirrors…..
He’s referring to actual metrics there. You realize that, right? That is: Specific measures of market depth which haven’t recovered since February 2018 and were further impaired in March of 2020. He wasn’t making a nebulous claim. You can measure market depth. What he’s saying isn’t a debate. There’s nothing to disagree with.
Yeah, I know he’s talking about market metrics, they changed before the pandemic, actually changed waaay before the pandemic, so not sure why he commented that they have changed “from the pandemic”,
I know he’s not inferring it was caused from the pandemic, but even if he said, “since the pandemic” doesn’t make sense because none of this has anything to do with the pandemic.
It makes perfect sense. They are still impaired from the pandemic. I’m not confident that you know what metrics he’s talking about, frankly. I think, rather, that you were keen to criticize and you assumed that no one would reply to you. Alas. So, what measure are you using? What are your metrics? And what’s your reference point for “waaay?”
Hey ANON, an interesting idea. Following in the revered tradition of all manners of dividend washing and end of quarter cash swaps.
But, serious question: what is the magnitude of equity holdings by institutions subject to Basel3 rules? I’m out of touch, but I thought that most banks had dramatically pared down stock and bond inventories.
Are the jockeys on the equity desks at banks getting aggressive again? Aggressive enough that their holdings would materially impact their Basel3 ratios?
Thanks.
Seems to me that Skynet lives…and feeds on the markets .