

A few days ago, I reiterated the absolute necessity of taking systematic trading and mechanistic flows into account when attempting to make sense of things in modern markets.
Whenever I broach this subject (so, every other day) I try to avoid coming across as unduly abrasive, especially considering what might appear, on the surface anyway, like an odd juxtaposition between an obsessive focus on systematic flows and my steadfast contention that fundamentals will always matter, that technical analysis as a “science” is largely useless and that the macro is always paramount.
The problem on most days is just that absent some obvious link between a fundamental or macro catalyst and the price action (e.g., earnings or, in the Trump era, a tariff tweet), the market wraps you read purporting to explain the “why” are mostly just stories.
Consider, for example, that on Nomura’s models, vol control rebalancing flows on Monday amounted to nearly $14 billion of added equities exposure. As the bank’s Charlie McElligott noted, that was a 97.1%ile one-day change.
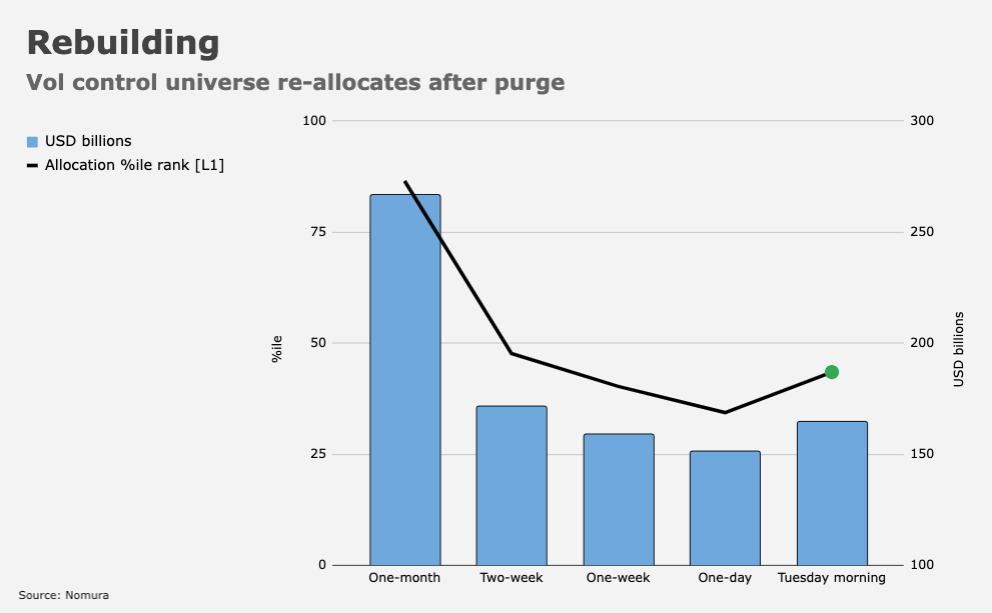
That came after September’s mini-swoon and accompanying spike in realized vol, which prompted the target vol universe to slash exposure to US equities into just the 34th%ile from the 90th%ile (figure above).
Assuming spot stays a semblance of well-behaved and realized vol continues to normalize, the model suggests another $55 billion re-allocation from the target vol cohort over the next two weeks.
Those are, of course, just estimates. And they’re contingent on spot not gyrating wildly from session to session. The point is simply that these are your under-the-hood, mechanical flows. In some (I’ll eschew the temptation to say “many”) cases, they matter more than any narrative you read in daily market wraps.
Consider also CTAs. “The aggregate equities net exposure (‘long’) is up to 75th%ile after having added an astounding +$122.7B over the past one week alone across global Equities futures,” McElligott wrote, in a Wednesday note.

Referencing the figure (above) he added that although overall estimated exposure isn’t yet sitting at a historical extreme rank, “the impulse ‘cover shorts and flip long’ flow signal turns over the past week is very significant and will need to be monitored.”
It’s always difficult to find any single, “right” word to describe these flows, because the systematic universe isn’t a monolith. But quite plainly, the mechanical impulses outlined above played a role in explaining the “why higher” (as Charlie put it Wednesday) following the S&P’s first 5% pullback in a blue moon.
Meanwhile, the resumption of vol-selling has been “swift,” “violent” and “breathtaking,” McElligott went on to remark, adding that the market is now trading “extreme ‘Long $Gamma / $Delta’ again.”
If you’re wondering whether the rapid resumption of the virtuous feedback loop has already put us back on the brink of stability breeding instability, McElligott said Wednesday that extreme CTA positioning both on the long equities side (shown above) and, importantly, on the short bonds side, “of course sets up a larger crowding / unwind risk as each gets more extreme.”
And while the market’s new melt-up has served to make upside tails great again (sorry, bad joke), Charlie also noted that “the ferocity of the return back near all-time highs… again see[s] SPX Term Structure, Skew and Put Skew going bid.”


You must be logged in to post a comment.