

Forget the “everything rally.” That’s not nearly colorful enough as a description of 2020’s various market milestones.
Instead, BofA’s Michael Hartnett calls it a “Frankenbull.”
In a note dated Thursday, Hartnett lists the attributes that, when stitched together, comprise what critics have variously charged is a hideous monstrosity.
Central banks, Hartnett wrote, have purchased $1.3 billion in assets every 60 minutes since March. He could have said “every hour,” but I suppose it’s more poignant if you use minutes.
There have been four rate cuts every five trading days, he went on to say, before citing a record low on the MOVE, the lowest CCC yields in a half-decade (figure below), $3.4 trillion in Treasury supply, a decade-high in global equity valuations, and an incredible $139 billion in equity fund inflows over the past six weeks.

He also cites record issuance for US investment grade and high yield credit.
As regular readers are aware, I update the corporate bond supply figures each week. It’s remarkable (to say the least) that borrowing costs for corporates are near record lows in a year that featured the worst economic downturn in a century.
In the same vein, record-breaking issuance is a testament to the power of the Fed’s backstop for the US corporate bond market. The (literal) Fed bid for credit played a crucial role in shoring up psychology, and thereby keeping the market wide-open to corporate borrowers. This dynamic continues unabated. IG issuance totaled more than $36 billion for December through Thursday. That took the YTD total to nearly $1.75 trillion.

High yield, meanwhile, has seen $15 billion in additional supply this month. Junk borrowers tapped the market for almost $420 billion in 2020.
Note that going forward, it’s entirely possible the rally will continue, at least in US IG. While the yield on offer may be paltry in a historical context, it’s juicy compared to government bonds and stacks up favorably against EUR credit, for example.
“Our base case is for credit spreads to reach historical lows in the first half of 2021 driven by low Treasury yields, improving technicals, and a yield grab environment resembling that following the financial crisis,” BMO’s Daniel Krieter and Daniel Belton, said Friday. “The major risks to this view include an underwhelming economic recovery and an increase in inflation which disrupts Fed accommodation.”
Lipper’s data showed IG funds took in another $2.9 billion in the week to Wednesday. There has been just one week of IG outflows since April.

High yield funds managed to eke out a small inflow. EPFR’s data showed a second week of outflows for junk (-$600 million).
“If one is concerned about the corporate bond market, consider that there is now a record level of $17 trillion of negative-yielding debt globally,” BofA’s Hans Mikkelsen wrote late last month. That figure is now more than $18 trillion.
If you’re looking for yield, the US high grade market comprises just 13% of the global IG fixed-income world, but, as Mikkelsen went on to say, it “pays out a record 40% of yield income.”
As Mikkelsen’s colleague, Hartnett, noted Thursday, corporate bond funds raked in an annualized $340 billion in 2020.

How does it all end? Well, nobody knows, really. That’s the quadrillion-dollar question.
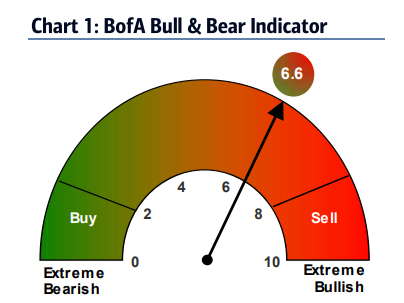
What we do know is that BofA’s pseudo-famous “Bull & Bear Indicator” rose to 6.6 this week. That’s getting close to a contrarian sell signal.


I love it, “frankenbull”!
We’ve been in a contrarian sell signal since 2009. Even the 666 achieved on the SP500, looking back at the charts now, the indicators didn’t go that low. So, maybe it’s fair to count that 666 as a pull back in the Frankenbull that started in, what, let’s say 2001? For me, I’m going to say the early 1980s. That’s when all this mess started.
Let’s face it, the financial economy cannot be allowed to break. At this point, we all have to know that if it does, we are all broke. Companies gone overnight. Pensions, annuities, and union retirements, take what, a 60% haircut. Equities, 90% peak-to-trough decline?
We have to keep expanding credit. We have to keep moving forward. There is no repairing the system we have. Keep it growing is the only choice we have. And, especially so since we never seem capable of mustering even incremental reforms. (Ok. maybe Sarbanes Oxley…this is an example of our incremental reform. That shows what we are capable of at best.)
We have the financial economy and system we have. It’s not going to change. No one wants a collapse.
Keep feeding the Frankenbull and keep racking up the Fed balance sheet. Years from now, $7T will seem tiny. A Swiss-based asset manager was interviewed about seven weeks back. He suggested in the interview that we see the Fed balance sheet at $40T. Why not? (The interview is recommended listening, by the way.)
Let us all have a prayer for three or four years of 4% inflation. Whether or not our prayers are answered, the path we are on is the only path we can travel right now. Collapse is not an option. We have to keep expanding credit and spending.
Long live the Frankenbull.
If the central banks run out ofscope to inflate the markets, the ones who have benefitted the most are most likely to feel the pain.
How do you know when confidence in central banks ability to reflate morphs from something that can be relied on to something that loses its power? I really wish I knew the answer to how that narrative flips.