

Bad news: Good news.
The first of this week’s sparse US economic data was inconsistent with the notion of a dovish Fed.
Activity in the mighty services sector was more robust than expected last month, according to ISM’s survey, which printed 56.5 for November.
That marked a sizable beat to consensus (53.5). In fact, it was nearly a full point higher than the most optimistic estimate from five-dozen professionals who earned the right to guess by spending four years (and one used Bentley Continental) on ornate, framed pieces of faux parchment paper signed by the dean of something.

The business activity gauge in the ISM report rose to 64.7, a remarkable leap from October and the highest since December of last year.
This outstanding news from the services-based US economy was devastating for market participants keen to see evidence of Main Street malaise. Pain on Main Street is conducive to less aggressive monetary policy, and thereby a resumption of the wealth effect through stocks and bonds that nobody on Main Street owns. Once Main Street starts hurting, Wall Street can start healing courtesy of a more accommodating Fed. Not such luck on Monday.
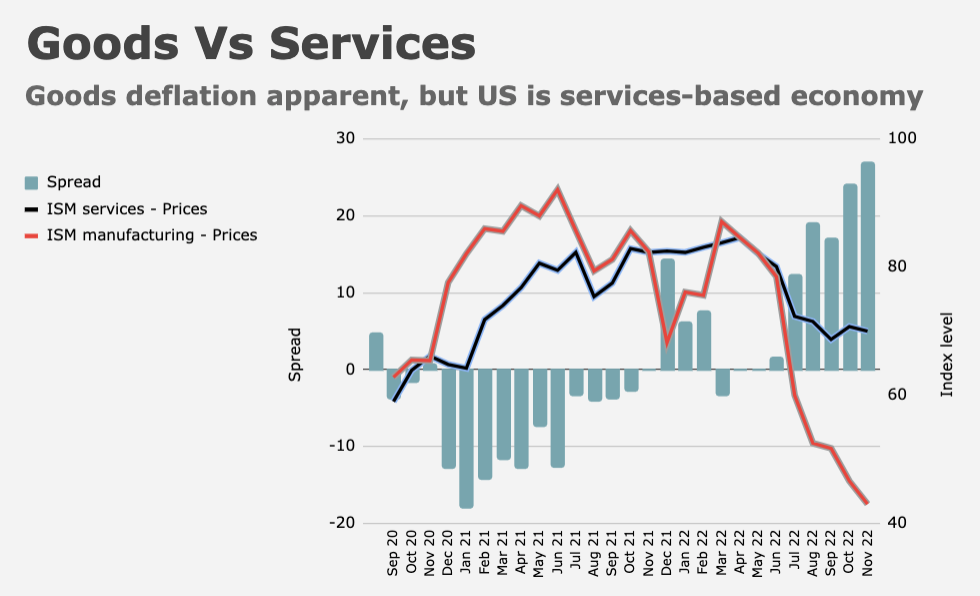
Coming as it did on the heels of Friday’s jobs report (which showed regular people made far too much money last month), Monday’s ISM services print was unwelcome news indeed. Fortunately, the final read on S&P Global’s services sector PMI for November was 46.2, leaving a disparity between the two gauges large enough to drive a truck through (grey bars in the figure above).
Chris Williamson, Chief Business Economist at S&P Global Market Intelligence, pretty clearly believes the US might be headed into recession. “The survey data are providing a timely signal that the health of the US economy is deteriorating at a marked rate, with malaise spreading across the economy to encompass both manufacturing and services in November,” he said Monday, adding that “the data are broadly consistent with the US economy contracting in the fourth quarter at an annualized rate of approximately 1%, with the decline gathering momentum as we head towards the end of the year.”
Meanwhile, ISM respondents painted a picture of “continued improvement in supply chain and logistics performance.” “A new fiscal period and the holiday season have contributed to stronger business activity and increased employment,” a chipper-sounding Anthony Nieves remarked.
The new orders index in the ISM survey barely fell and the employment gauge moved back into expansion territory. The prices gauge hardly budged from elevated levels, leaving the yawning gap with the plunging prices index in ISM’s manufacturing survey mostly unchanged.
Markets (and the Fed) will focus on ISM, not S&P Global’s survey, which is bad news for stocks at the margins. “It’s a bit of a reminder that the Fed’s work isn’t done yet,” Cameron Crise remarked. “Especially as the service sector is where marginal inflation pressures are likely to come from (or perhaps more accurately, where current inflation pressures will recede most slowly).”
S&P Global’s Williamson offered an incongruous read. “A striking development is the extent to which companies are increasingly reporting a shift towards discounting in order to help stimulate sales, which augurs well for inflation to continue to retrench in the coming months, potentially quite significantly,” he wrote.


“In fact, it was nearly a full point higher than the most optimistic estimate from five-dozen professionals who earned the right to guess by spending four years (and one used Bentley Continental) on ornate, framed pieces of faux parchment paper signed by the dean of something.”
This is now officially my favorite of your quips!
Yeah, I’m running out of new ways to make that joke. Hopefully I can keep coming up with fresh takes on it.
With a glance at my own faux parchment, it’s not only signed by the dean of something, but also by a president, a governor, and a secretary of something, it’s written in Latin, and uses at least 6 different fonts!
(The gold embossed seal is my favorite part)
But you’re wrong about the Bentley. It was new, not used.
I’ve long thought the Markit (now S&P Global) surveys were better than ISM.
Employment is a lagging indicator. Also the household survey has been far weeker than the payroll survey over the last few months. The divergence if it continues, in times past has been a leading indicator for employment in favor of the household survery. One difference in the surveys is the fact that payroll numbers generally count larger companies- a household view captures a broader picture of the entire economy since it is not dependent on the BLS finding smaller companies to survey for payrolls. Well that is not definitive since it has only been a few months. A couple of more months with household survey lagging would likely indicate employment is a lot weaker than the payroll numbers suggest.
Something like 15-20 years ago I was one of the people called for the household survey. Was it once a month or weekly? I don’t remember. But I do remember it was a PITA because they asked the same question over and over. They would not let me just answer “there were no changes”. Very annoying. But the survey was pretty granular.
An uninformed question: are these two surveys supposed to be measuring the same thing? Or, by way of example only, does S&PGlobal include smaller businesses?