

Nine months ago, if you wanted to buy a nice property in the US, you had to bid above asking, and you had to do it quick.
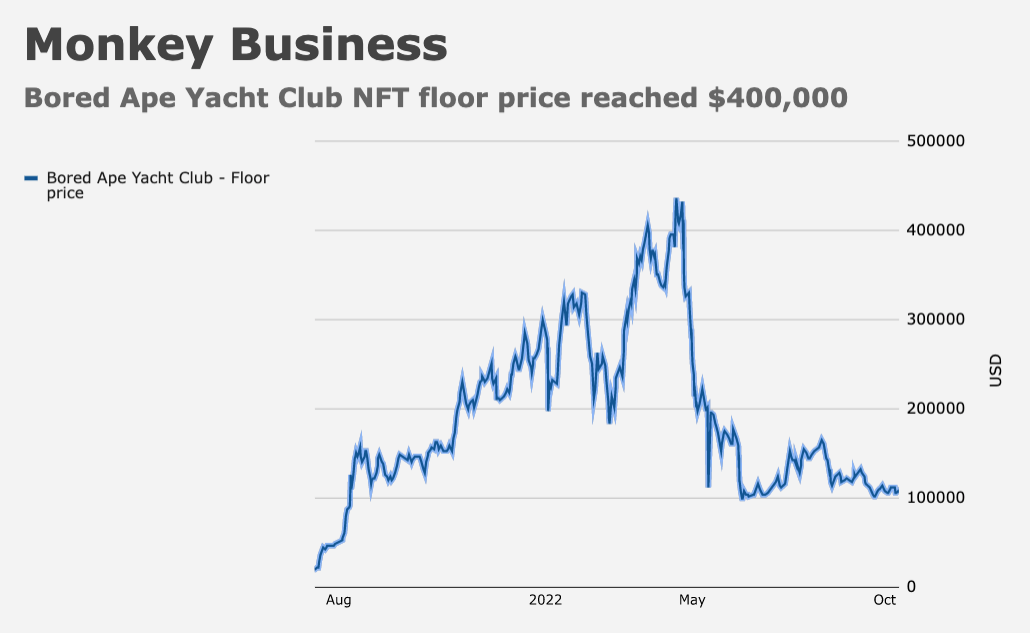
Even then, there were no guarantees. In all likelihood, you’d end up in a bidding war, your better judgment overwhelmed by the same kind of delerious FOMO that compelled otherwise rational adults to spend $300,000 (or more) on Bored Ape Yacht Club NFTs.
Nationally, home prices remain buoyant, but make no mistake: The market has changed. On Friday, as part of my ongoing effort to find the perfect relocation locale following a seven-year, self-imposed exile on an (increasingly commercialized) island, I inquired about a fine home in Virginia on nearly six acres. I was told I could likely buy it for 25% lower than the listed price.
That’s anecdotal (and I doubt it’s indicative), but after 10 months of inquiries I can say, without equivocation, that the Fed’s efforts to squeeze the housing market have had a demonstrable impact. I now have so many anecdotes I could pen a generic, Bloomberg-style “human interest” story — one of those intentionally downbeat pieces that documents the individual plight of random people around the country. “Mrs. Richards, whose husband passed away during the pandemic and who turned 81 last month, is transitioning to assisted living. When she went to list her stately four-bedroom tucked away in an upscale subdivision outside of Knoxville, Tennessee, she discovered it would barely fetch the lowest neighborhood comp despite being nearly twice as large.” (That’s made-up copy, but it probably describes someone’s situation.)
I quite enjoy perusing the latest headlines on Redfin’s news section, although I almost feel bad about it now given layoffs at the company. According to an article published on December 8, would-be buyers now harbor something that sounds like a deflationary mindset, a complete one-eighty from the frenzied state of affairs witnessed at the peak less than a year ago.
“The total number of homes for sale increased 15% YoY during the four weeks ending December 4,” Dana Anderson wrote. That was the largest increase ever, and notably, it came as new listings dropped 20%. As Anderson explained, that “means homes are sitting on the market as prospective buyers stay on the sidelines and wait for mortgage rates and home prices to decline further from their peaks.”
In June, the average home that sold was on the market for just 17 days. By early this month, that figure was 37. The rate of price appreciation has virtually flatlined. The median sales price was up less than 2% YoY during the same four-week period analyzed by Redfin, and the median asking price rose just 4.4%, the most sluggish pace of growth in 31 months.
Although mortgage rates have fallen sharply over the past several weeks alongside the rally in the US long-end, homebuyer mortgage payments were up almost 38% YoY as of December 4, based on a four-week rolling average of the median ask (figure below).

Plainly, that’s going to crimp demand. If you know demand is likely to be curtailed, and you understand anything about the interplay between supply, demand and prices, you’ll be inclined to wait before you buy, even if mortgage rates are lower than they were at the highs.
Of course, supply is constrained by all manner of factors including, ironically in this context, high borrowing costs. Constrained supply and demand demographics are the only two things keeping prices from plummeting.
On Redfin’s data, 6% of homes had price drops during the period mentioned above, down from a peak of 7.5% two months ago, but up dramatically from just 2.7% during the same period last year and the year before.
It’s with all of that in mind that markets will be treated to a raft of monthly housing data this week, starting with NAHB on Monday. If homebuilder sentiment falls again in December, it’ll be 12 for 12. That is: 12 declines in 12 months. Consensus expects a slight uptick.

Less than 24 hours later, we’ll get a look at housing starts and permits. Starts and builder sentiment are joined at the proverbial hip (figure above).
Wednesday brings existing home sales, which are riding a nine-month streak of declines. As a reminder, October’s 4.43 million annual pace was the slowest since December of 2011 if you don’t count the pandemic months. Consensus expects sales dropped nearly 5% in November.
On Friday, following the government’s personal income and spending release, new home sales figures for November will cap this week’s pre-holiday data deluge. Figures released late last month suggested demand for brand new, cookie cutter boxes complete with walk-in showers, fancy kitchen backsplashes and engineered “wood” floors that’ll make you forget you paid $600,000 for a $250,000 house, was more robust than expected. Median prices hit an all-time record high, and the annual pace of price growth re-accelerated to more than 15%.
As I noted while editorializing around the last new home sales release, the juxtaposition between price growth and accelerating mortgage rates is remarkable (figure below).

That conjuncture, contrived as it was by my efforts to goal-seek a compelling chart, is unprecedented. Eventually, I’d argue, it’ll prove unsustainable.
And yet, as Redfin’s Anderson noted in a separate article published last week, the multi-year surge in prices provides a big cushion against a market downturn for anyone who bought into the boom and, really, for anyone who bought after the boom.
Note that the figure (below) covers buyers who purchased from January 2021 through September of this year.

“Just 3.4% of US homeowners who bought in the last two years would be underwater on their mortgage if home values were to fall 4% by the end of 2023,” Anderson said, citing Redfin’s economists. In such a slump, “the typical home bought over the last two years” would still have gained $27,000 in value.
Needless to say, had you bought in 2020, your situation is probably even better — you’ve built up more equity or you refinanced at record-low rates.
But, as the chart shows, the situation doesn’t look as favorable for those who bought in 2021 and 2022 in a scenario where prices fall more dramatically. If, for example, home values fell by 12%, the share of homeowners covered by Redfin’s analysis who’d be underwater would rise into the double digits.
I don’t think a double-digit price decline nationally is out of the question. Particularly in a recession scenario. As Larry Summers put it two weeks back, “At a certain point, people start putting their houses on the market and then you see house prices falling and then other people rush to put [theirs] on the market. Once you get into a negative situation, there’s an avalanche aspect.”


Inflation adjusted prices have already fallen. Prices will be soft but most likely you will see a flat market over the next 5 years except for moon shot markets.
H, join me in Ann Arbor, I need a friend. I am considering purchasing a dilapidated house in cash because I’m a little worried prices aren’t going to drop enough in the nicest locations. Going to be patient though, curious what q1 2023 will bring as everyone is expecting some sort of credit event.
I recently left my own self imposed exile as well.
The end of the year holiday season means a slowdown in both the number of new listings and purchases. As of a few weeks ago, at least in one large Southern California metropolis, if a listing was moving into the 30-45 day time on the market without a potential offer, those listings have been pulled to be re-listed in January, 2023. That restarts the clock on “days on the market”. Of course this is just silly because anyone can look up the history of listings and prices on a home, however, this is what the brokers are recommending so that the seller’s listing doesn’t appear stale and subject to potential buyer’s thinking they can float a “low offer”.