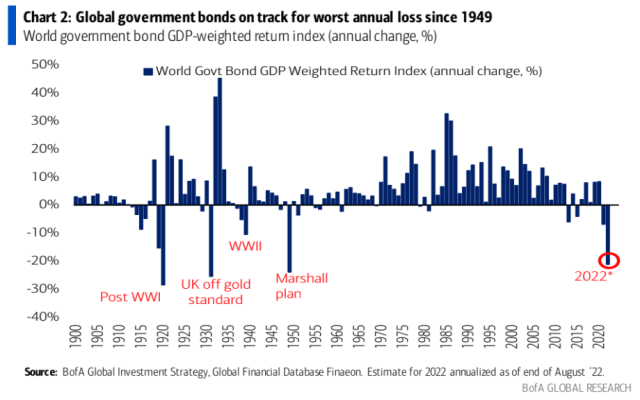
The worst rout in global government bonds since 1949 rolled on Monday, as US yields surged again amid chaos in UK assets.
Another sizable selloff found 10-year Treasury yields cheaper by some 20bps into the afternoon. “A nearly 20bps move in 10-year rates is always a noteworthy development, although in the current market backdrop such outsized volatility is becoming increasingly commonplace,” BMO’s Ben Jeffery and Ian Lyngen remarked. “The most eye-catching aspect of Monday’s repricing was the impetus — or specifically the lack thereof as it was only the ongoing moves in gilts that received any fundamental credit for pressing the repricing.”
All eyes were on the pound, as traders pondered intervention, verbal or otherwise. A weak-willed statement from the Bank of England contributed to renewed risk-off sentiment, as Andrew Bailey appeared to rule out an inter-meeting rate hike. The dollar firmed, then pressed higher. Equities were flummoxed, unsure what to make of the turmoil in “smarter” assets.
It’s worth reiterating that the generational bond selloff (figure below) is the proximate cause of this year’s risk asset malaise. The sequencing of volatility migration was different this time, with rates leading the way.
Bonds, instead of being a diversifier, vol-dampener and cushion in multi-asset portfolios, have instead been the sponsor of an ongoing market event.
It looks as though the baton may now be passed to FX. There’s talk of a “Plaza moment” which, if it comes at all, may be too late if the last week is any indication.
Of course, it’s impossible to disentangle what’s happening in FX from rates, and vice versa. And lest we should forget as the profit reckoning which was pushed out in Q2 looks set to “realize” during Q3 reporting season in the US, the selloff on Wall Street during the first half of the year was entirely valuation-driven, which means entirely rates-inspired.
With that in mind, consider the astounding figure on the right (below) from SocGen’s Andrew Lapthorne who, using principal component analysis, isolated “a policy factor that relates to the demand for bonds.”
“A normal bear market is usually accompanied by a collapse in risk appetite, often itself a function of a deteriorating macro environment where earnings momentum and profits slump, defensives outperform cyclicals, Value underperforms Quality and credit-risk factors become all important,” Lapthorne wrote Monday.
As the charts show, 2022 was instead a rates story. “The main driver of asset markets this year, however, has not been risk aversion but the complete collapse in the demand for bonds,” Lapthorne went on to say. “A bond-led selloff is different to a ‘risk-off’ selloff, with bond volatility leading to valuation uncertainty.”
Although mitigating valuation risk will still be important going forward, it certainly feels as though we’re entering the next “phase,” so to speak, during which the brutal selloff in rates will begin to manifest not just in valuation compression for equities, but in real-world economic outcomes, and also in lower corporate profits.
When taken in conjunction with the worsening dollar crisis (which itself has serious implications for US corporate bottom lines), the read-through is that the next couple of months could be daunting indeed. As Lapthorne noted, referencing the figure on the left (above), risk appetite is now “dropping alongside a continuing collapse in the demand for bonds.”
If that sounds familiar to you, it should. It’s the “double-barreled risk to stocks” discussed right here less than 10 days ago.


I just submit a manuscript using PCR today. This site keeps my knowledge up and up and away.
H-Man, you know there is a silver lining in the rising interest rates. The 3 and 6 month T-bills are yielding 3,25 to 3.45 which is not chump change. Yes, a negative return with inflation factored but nothing like we are seeing in equities. Oh, I forgot and guaranteed.
And god I sleep like a baby…….patiently waiting…….
Whilst Principal Component Analysis can be useful I would treat the results with some caution. So much of the results from this analysis depends on the factors/data series you pick and the results are very sensitive to these inputs. That said, it can be illuminating.