

Volatility is likely to pick up over the next month, Goldman reckoned, in a note dated Friday.
If memory serves, the bank publishes a similar note around this time every year, outlining vol catalysts into year-end. Invariably, media outlets jump at the opportunity to squeeze a headline or two out of it.
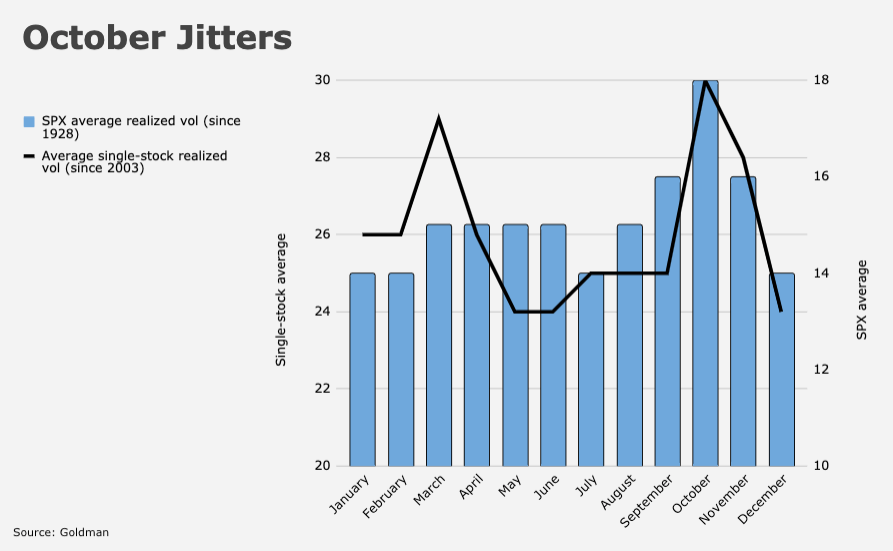
I’ll spare you the suspense: At the index level, the takeaway is just that historically, realized vol is higher in October. In fact, dating back three decades, every major benchmark and sector exhibits higher vol that month.
It’s not a coincidence, Goldman said, and it’s not merely the result of spikes witnessed in certain years, although I should note that depending on the benchmark, the phenomenon is less obvious if you use the median.
“We believe it’s a critical period for many investors and companies that manage performance to calendar year-end,” the bank’s John Marshall wrote, adding that “such pressures boost volumes and volatility as investors observe earnings reports, analyst days and managements’ guidance for the following year.”
The simple figure (below) illustrates the point. Goldman uses charts for a half-dozen indices. The evidence is most compelling for US equities, although European stocks exhibit strong seasonability too, as does the Hang Seng (as if Hong Kong shares need another reason to behave erratically).
Marshall went on to suggest that it’s not happenstance that major market corrections have played out in October.
Elaborating on the same general idea mentioned above, Goldman wrote that in their view, “performance pressures for company managements (to meet full year expectations) and investors (final earnings catalysts for their performance year) exacerbate shifts in sentiment at this time of year.”
These dynamics could be especially relevant and/or pronounced in 2021, as management teams struggle with guidance given the persistence of the pandemic and myriad potential headwinds to margins, including soaring input costs, wage pressures and tax reform.
Goldman cited the seasonal pickup, but also “continued virus uncertainty and significant monetary and fiscal policy catalysts,” as factors that could push up volatility over the next four weeks.
As alluded to above, when you think about average volatility in October and the notion of a “seasonal,” you’d be remiss not to at least acknowledge historical instances of October fireworks with clearly identifiable catalysts. I scarcely need mention the most obvious examples, but one that might have escaped some investors’ minds is October 2018, when the combination of trade escalations and Jerome Powell’s “long way from neutral” misstep catalyzed a fairly dramatic swoon (red in the figure, below).

In any case, looking back over nearly a century, volatility tends to rise around 30% from August through October.
The rub this year is that, as Marshall wrote, it’s even “tougher to make money buying volatility at the index level [than usual], as index volatility is already elevated relative to realized due to continued pandemic concerns.”


