

We gotta stop it with these outsized close-to-close swings in spot equities.
Wall Street took another dive on Thursday, as Anthropic’s mega-IPO proved insufficient to bolster sentiment and otherwise calm frayed nerves around an AI trade that’s been shaky since mid-October.
Nvidia fell a sixth day (and an eighth in nine), as did Micron. The hyper-scalers were all down and SpaceX had its worst day since the November 5 semi panic.
A couple of readers have asked about systematic exposure and specifically if more selling’s on the cards from that cohort. The answer’s nuanced. I’ll focus on vol control here.
My vol control model shows about $143 billion of net selling since the October 29 local peak, not counting today’s selling.

As the figure shows, modeled SPX-equivalent equity exposure fell from $253 billion on October 29 to $110 billion on November 18, a 57% reduction over just 14 trading sessions.
The trigger for that, obviously, was the sharp increase in trailing realized vol, which is in turn a function of the dramatic widening in the distribution of daily spot outcomes which began in late October.
The “good” news is that exposure’s now just 22%ile on a six-year lookback, which in theory means we could see a significant “add-back,” so to speak, as the big-swing days drop out of the trailing sample window.

The figure above shows you the spike in realized vol (on the left) and the dropout schedule on the right. Note the bolded text below the rVol chart: “Smaller replacement moves lower realized vol.”
Take a moment to sit with that latter point. It’s the key to understanding what I mean when I say, as I did above, that “we gotta stop it with these outsized close-to-close swings.”
For these strats (and they’re not a monolith, but the point is just that trailing realized vol dictates their equity exposure) to dial their exposure back up, the index needs to calm down so we’re not just replacing one +/- 2% swing with another one in the rVol calculation. Days like Thursday don’t help.
The figure below shows you the potentials — i.e., what could happen, if things calm down. If, for example, the S&P manages to close more or less unchanged each day for a month straight, target vol’s a buyer to the tune of almost $70 billion on my model.
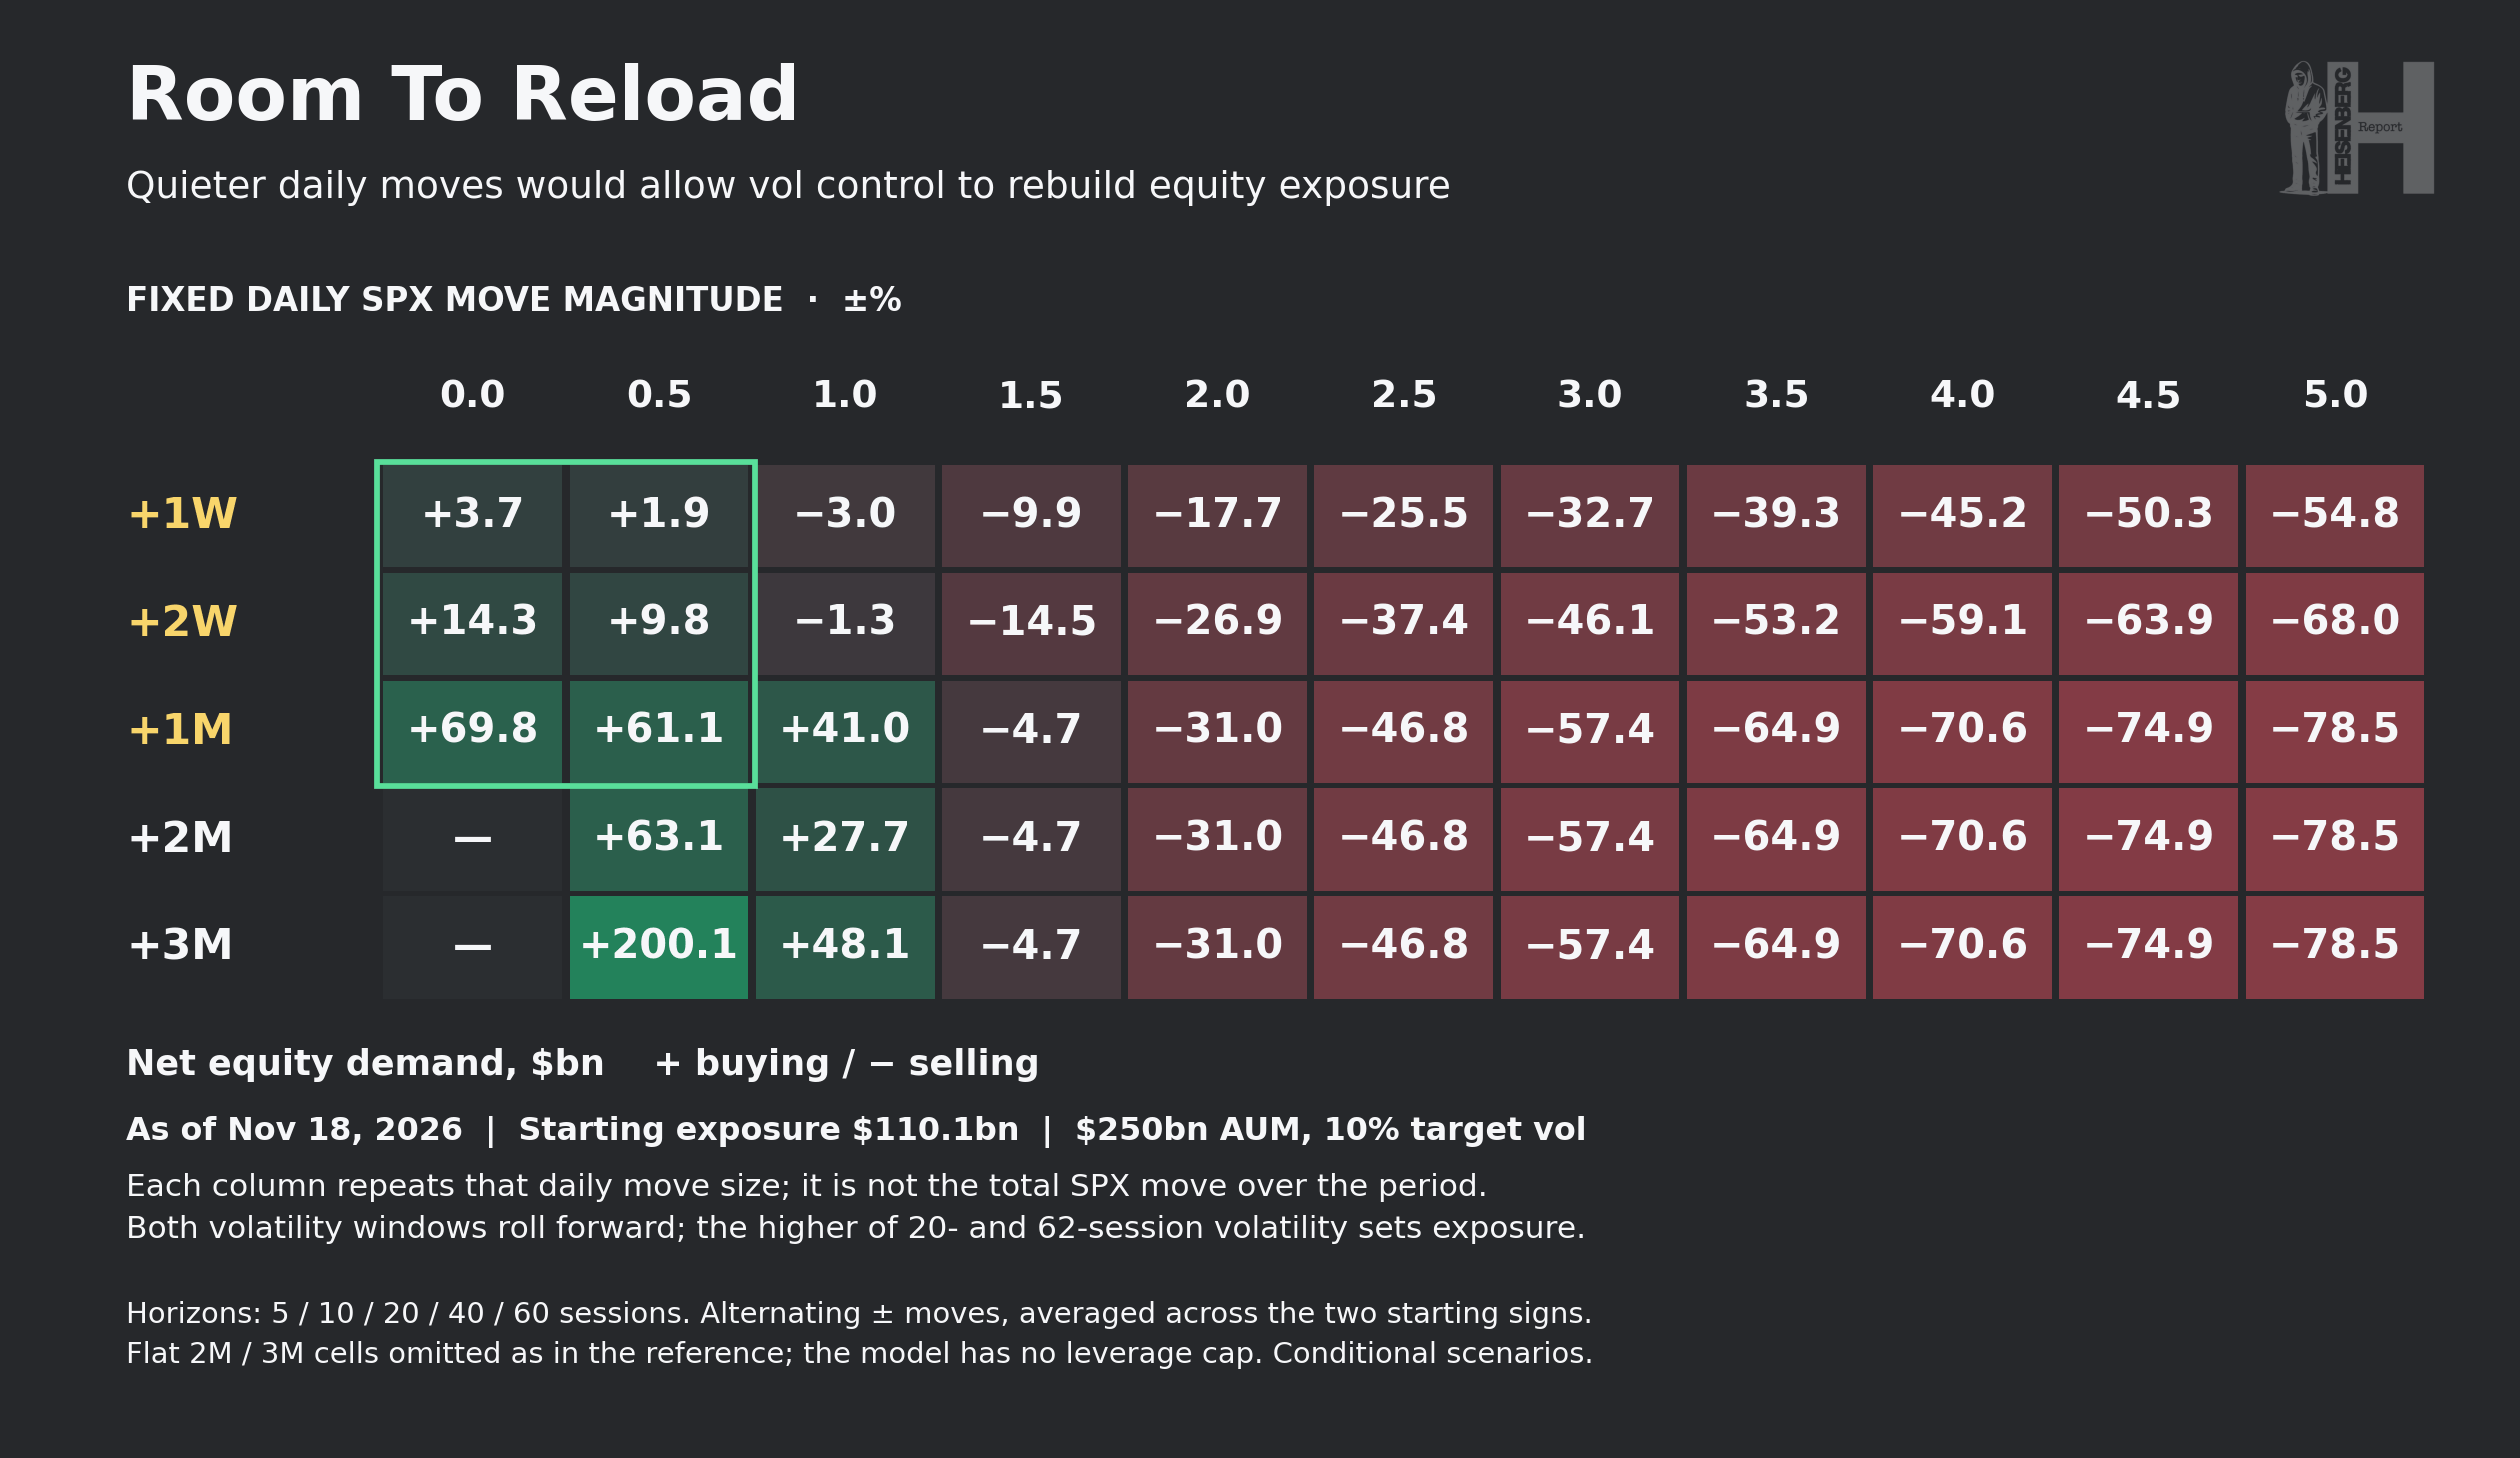
If the index spends the next three months making daily close-to-close moves of around ±0.5%, the model implies roughly $200 billion of cumulative buying in SPX-equivalent equity exposure.
However, if the waters stay turbulent, the model keeps selling. For example, daily close-to-close moves of 1.5% over the next two weeks produces another $15 billion of modeled selling. And so on.
That’s the math which explains why we “have” to start seeing some range compression if we’re gonna get that vol-control “buy” impulse.
Here’s comes a plug, but not a shameless one. All the charts you see above are based on my model, as updated every weekday evening in the Analytics .pdf.
This — modeled systematic positioning — need not be a mystery anymore. If you want to keep tabs on it (and a lot else besides), you don’t have to wait on a random article like this one. You can just subscribe to the Analytics mailer for $5/month, billed monthly on a recurring basis. Or you can make a $90 one-time payment and receive it every market day from now until May of 2028, thus guaranteeing no price increase for 18 months.
I’ve received so many inquires about this .pdf over the past several days that keeping the early adopter links a “secret” doesn’t make much sense, and is anyway compelling me to keep checking my email late into the night. So I’ll just make those links public. Here they are:
- One-time payment covering all 18 months: https://buy.stripe.
com/aFa3cu75m6OS1v10BM8Vi08 - Monthly recurring payments: https://buy.stripe.
com/9B66oGblCehkgpVgAK8Vi07
I’ve embedded a copy of the November 18 Analytics mailer below so that you can see what you’d be getting if you subscribed.
And I’d note this: The deck will get even better starting this very evening, which is to say beginning with the November 19 edition, the Analytics mailer will get four additional pages, including one dedicated to enhanced CTA coverage.
To keep things simple, I’ve made this a completely separate subscription from your normal Heisenberg Report subscription. The only thing they share is the payment processor, which is Stripe, as always. So, subscribing to, or canceling, Heisenberg Report Analytics has no bearing whatsoever on your existing subscription to the website. Monthly subscribers can cancel Analytics any time via the link at the bottom of each evening’s .pdf.
Although the only guaranteed deliverable as of right now is the daily .pdf, your Analytics subscription also entitles you to the occasional special report, like the one I sent around this week on Nvidia’s earnings. And probably a lot more going forward, even if I can’t yet say what “more” means.


Nice read. Thanks for the detailed explanation.