

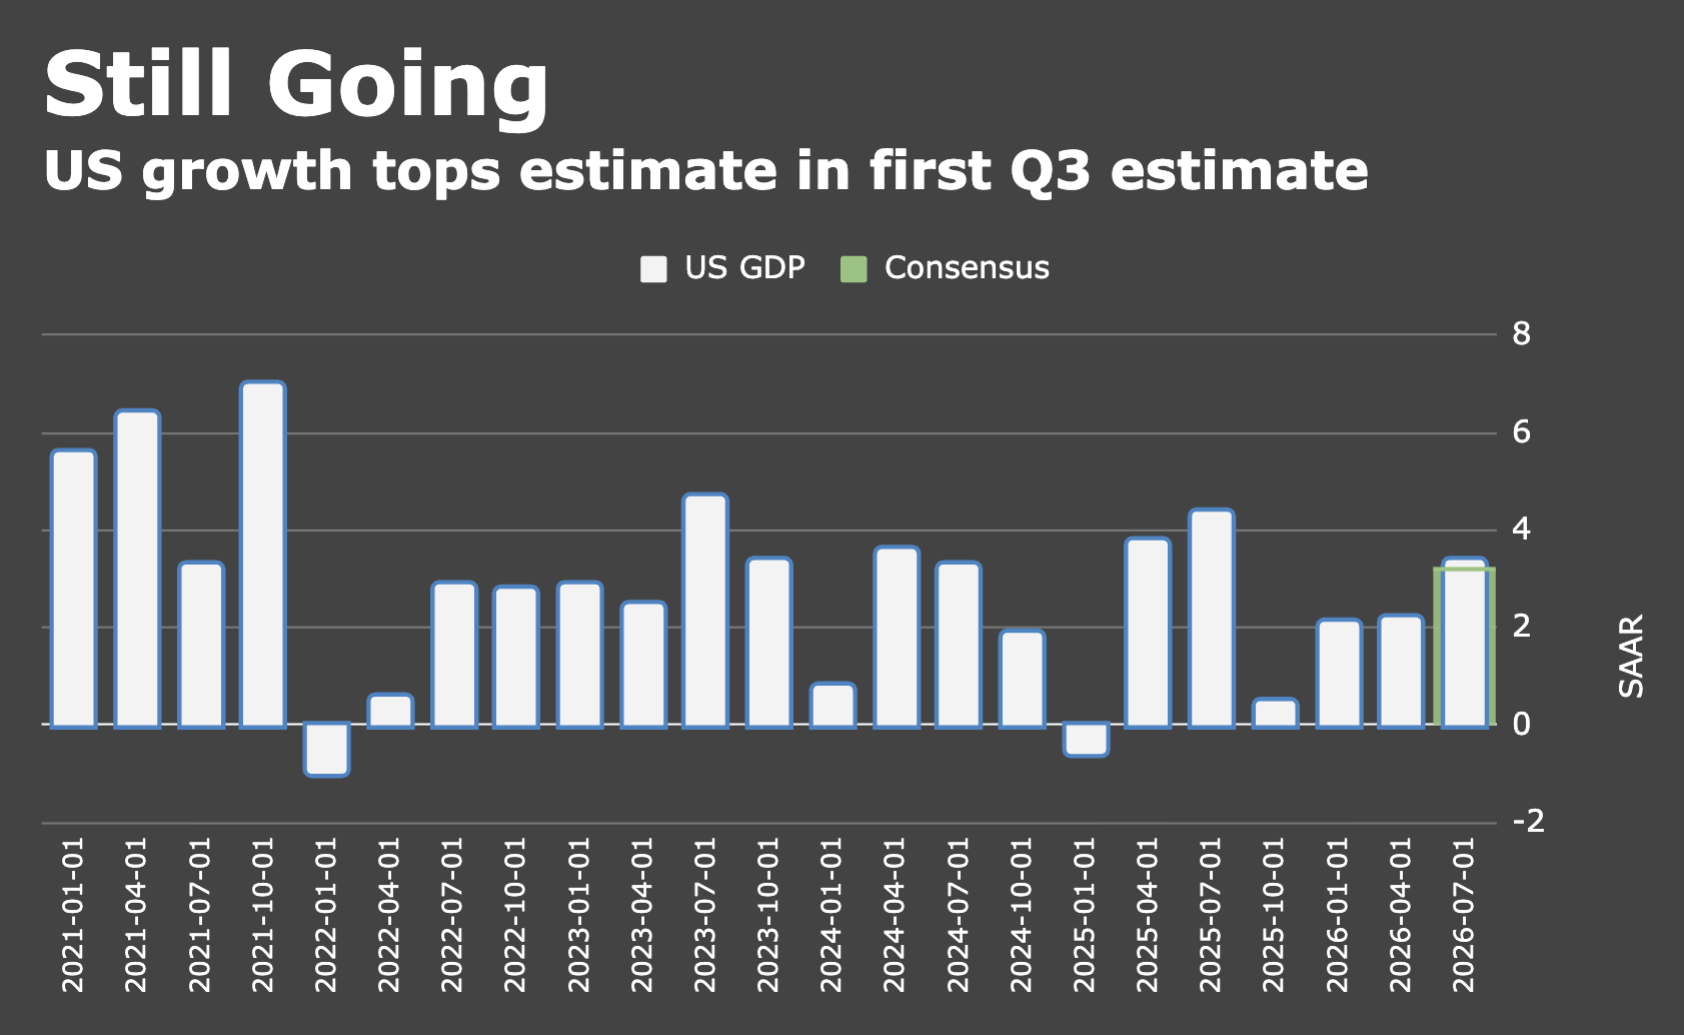
The world’s largest economy outperformed expectations in Q3 on brisk consumer spending and robust business investment, according to this week’s marquee US macro release.
The first read on GDP for the quarter ended last month boasted a 3.8% gain on the personal consumption line. That was considerably stronger than the 3.4% consensus and matched Q2’s pace as the briskest since Q4 2024.
As was the case in Q2, the personal consumption line accounted for 2.5ppt of the overall headline real growth readout, which was 3.4%, two tenths ahead of estimates.

I realize this doesn’t need repeating, but this is just a first-pass guesstimate from the BEA. These figures will be revised. Twice.
The key line from the release — i.e., the readout economists watch as the best barometer of underlying demand — was very strong. Real final sales to private domestic purchasers showed a 4.9% gain, the largest since Q1 of 2022.
Business spending aggregates and sundry proxies for AI capex looked quite strong as well. Nonresidential fixed investment showed a 12.7% gain, the third-largest since the GFC. The figure below shows you a simple proxy for the capex boom.

As a share of GDP, business investment was 15% in Q3. We’re just a few tenths away from breaking the TMT bubble record on that metric, and as the chart header gently notes, this strongly suggests the neutral rate’s higher, Kevin.
Running through the private, nonresidential line items that may be picking up AI spending, structures showed a 5.4% gain and equipment a near 21% advance, following 13.4% and 15.5% in Q2 and Q1, respectively.
The figure below shows you the contribution to the overall change in headline GDP growth from information processing equipment, computers and “peripheral equipment.”
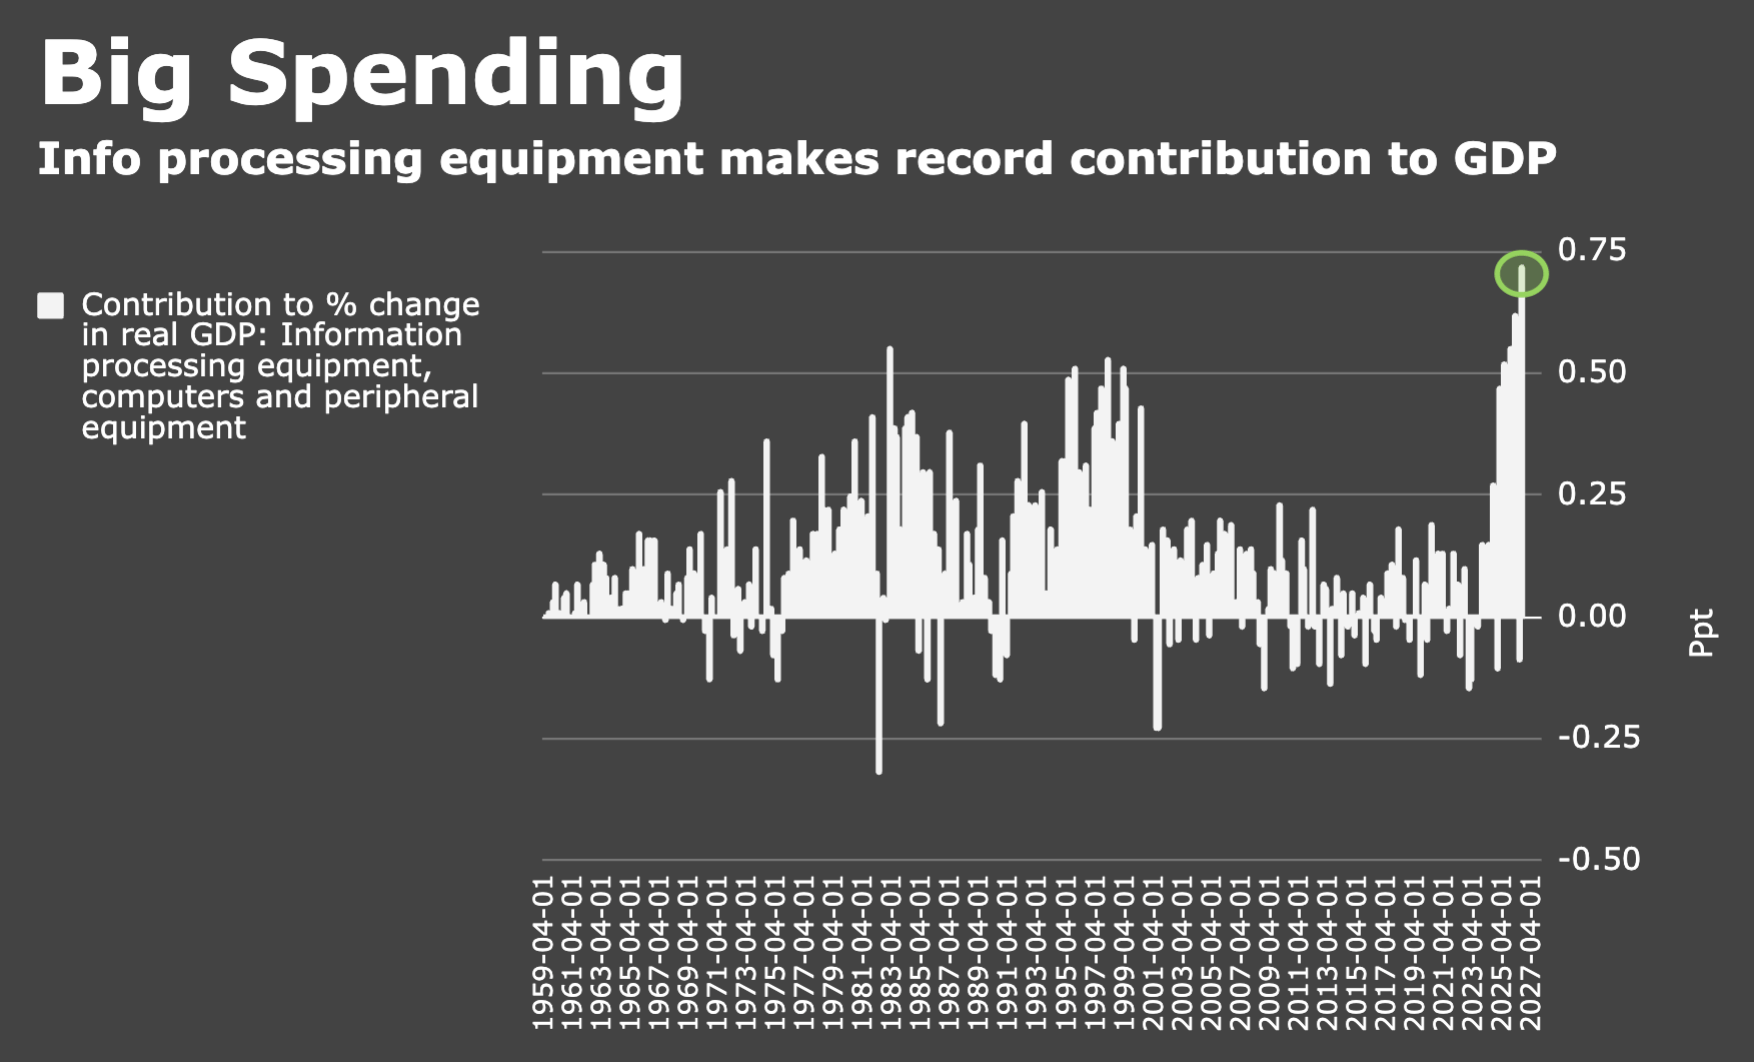
As you can see, that metric bounced hard from Q2 to print a new all-time record.
Not surprisingly, residential fixed investment was a drag, contracting 3.3%. It was the eighth contraction in 10 quarters.
I could go on, but the bottom line is that were it not for an outsized drag from net trade — which weighed on the headline growth print by 3.32ppt, the most since Q1 2025 when Trump inaugurated, no presidential pun intended, “Trade War 2.0”) — this would’ve been a barnburner of a report.
The drag from trade was likely also a function of the AI buildout: Not everything that goes into data centers is made in America. Some (a lot?) of that equipment has to be imported.


Are the capex and net trade statistics concurrent? That’s possibly significant given the high percentage of imported goods in the AI build out. You know, those chips and such mostly come from other countries, right?
Data centers did the heavy lifting, with foreign money corruption helping power the numbers higher. USA! USA! U esse!