

How high can bond yields go before stocks “notice”?
That question feels terribly clichéd if you’ve been steeped in the macro-market narrative long enough to witness the sometimes dangerous conjuncture of quickly-rising yields and stubbornly-resilient equities.
Over a decade, I dare say I’ve penned hundreds (plural) of articles on that subject. The answer (to the “How high?” question) is always the same: It depends. On any number of factors, most important among them the rapidity of rate-rise. The faster the more dangerous.
But as we’ve seen in recent months, equities can look past a lot in the way of negative catalysts when corporate profits (and, just as importantly, profit expectations) are booming, as they are this year. Q2 of 2026 was the best quarter for US EPS growth ever outside of recession rebounds. Margins have never been fatter. And the good times are expected to continue.
With that in mind, consider the figure below, from JPMorgan’s equities team. It tries to show the relationship between equity valuations and benchmark US yields under different profit growth scenarios.
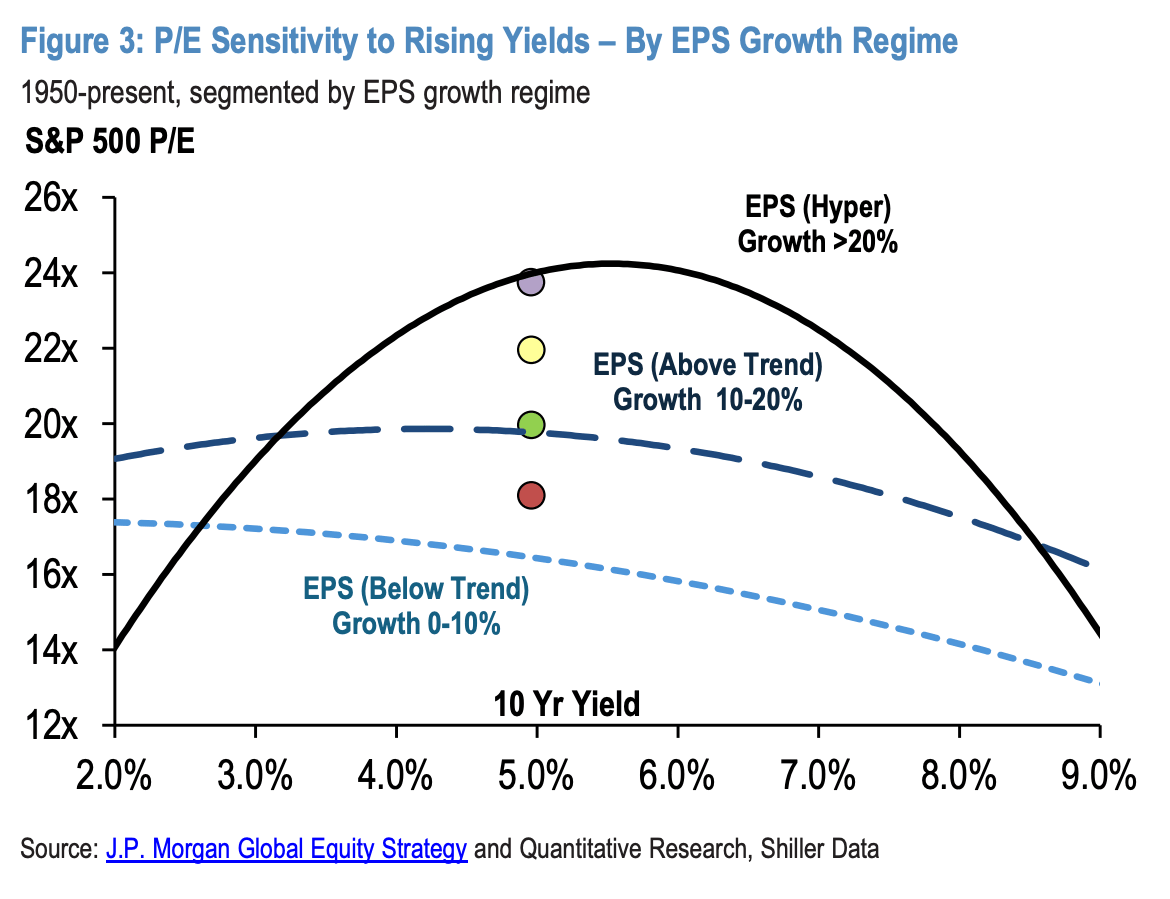
As indicated, the arcs represent earnings regimes: The light blue dashed line’s below-trend profit growth, the dark blue line’s above-trend growth and the black, solid line’s a “hyper” growth scenario, defined as YoY EPS expansion exceeding 20%.
Just to put my cards on the table, I don’t think that visual’s especially useful. For one thing, it doesn’t capture the rapidity dynamic mentioned above. Another 50bps higher on 10s would be tough for stocks to digest regardless, but if that hypothetical 50bps played out over, say, two weeks versus two months, the downdraft in equities would be commensurately more acute.
Beyond that, it’s important to remember that the de-rating we’ve seen this year on the S&P is a function not of a sharp selloff, but rather of explosive upside to forward earnings. That makes this a bit self-referential, and it presents what I’ll call Fata Morgana risk: If some left-field catalyst were to collapse earnings expectations overnight, the ostensible cushion inherent in an 18X forward multiple would disappear immediately, which is to say the index would mechanically re-rate several turns higher. Stocks’ “cheapness” would be exposed as a mirage.
JPMorgan’s analysts addressed some of those concerns in the color accompanying the visual, however obliquely. “Based on long-run history, there is an inverted ‘U’ relationship between the 10-year yield and S&P 500 multiples, with the inflection point a function of the earnings growth backdrop,” the bank said. “With forward consensus EPS growth still calling for 20%+, history suggests the multiple can remain supported and equities should be able to withstand a 10-year yield closer to 6% if these growth projections are realized.”
The word “if” is doing a lot of work in that latter excerpt from the bank’s note. Indeed, it’s doing so much work that we’re into question-begging territory. If corporate America grows the bottom line at a 20%+ clip in perpetuity, then virtually nothing will be sufficient to bring about a sustained drawdown for stocks. (Who offloads stakes in companies growing earnings by more than 20%?)
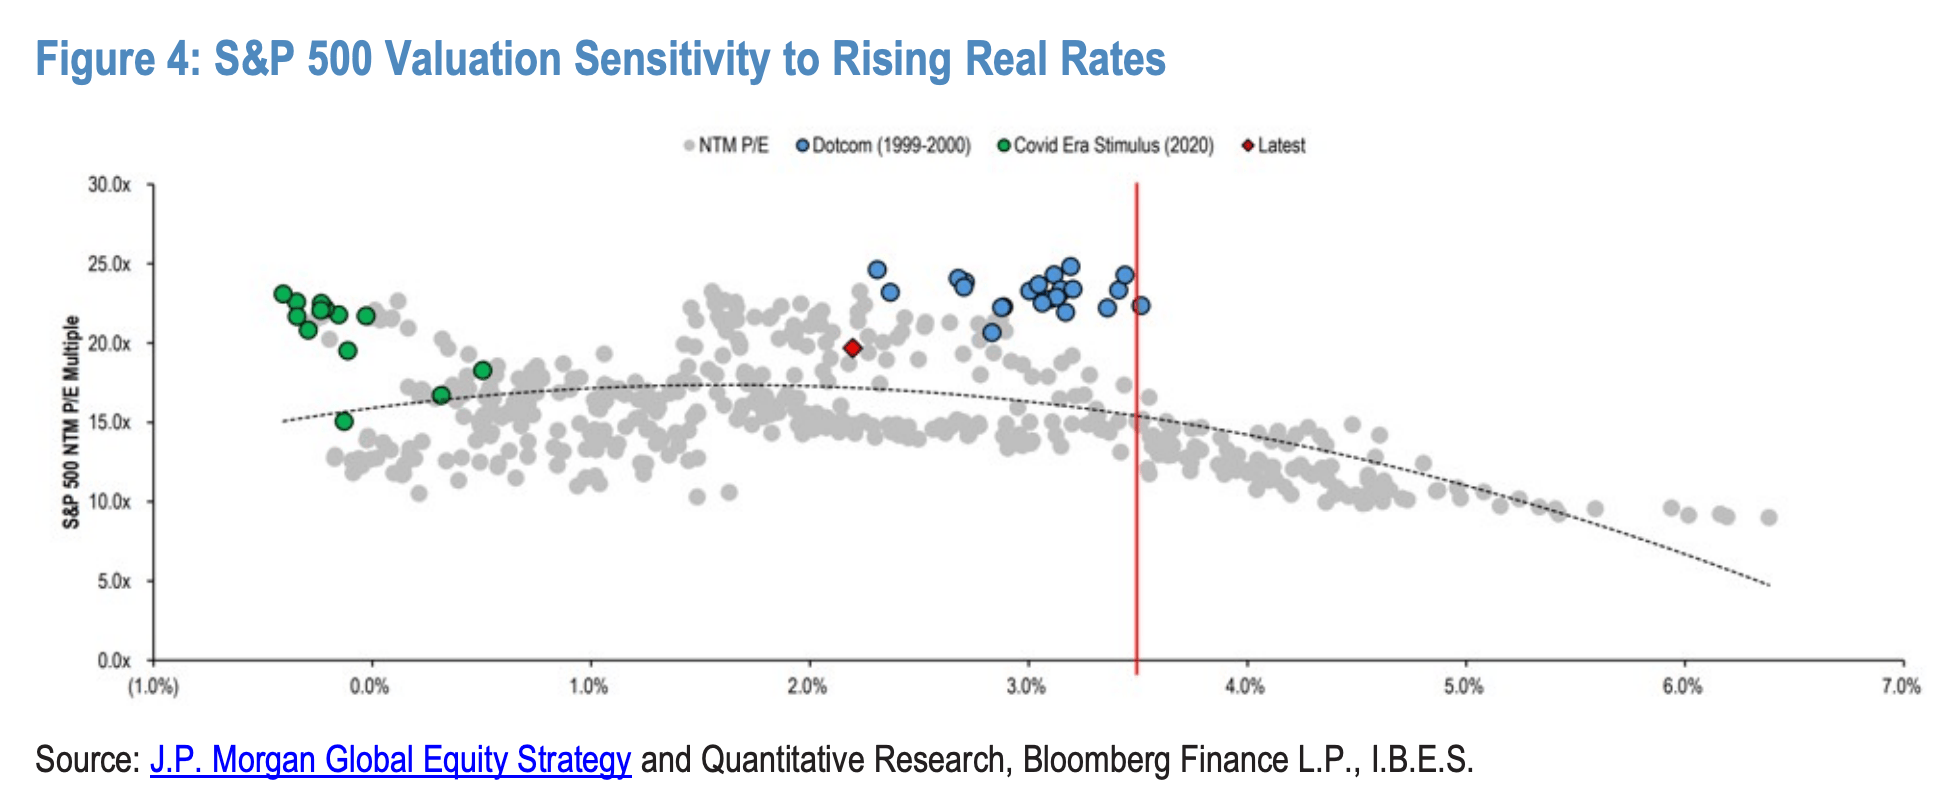
For those interested, the figure above, from the same note, shows you the long run history of forward multiples with real yields. The blue dots show you the dot-com era, the green dots the COVID stimulus days. The red diamond is the “current” marker.
Anyway, a lot hinges on the Fed and the Mideast, JPMorgan went on to say. “Equities should remain anchored by earnings, less by rates, as long as the hiking cycle stays shallow,” the bank wrote.
One risk is that “the curve starts to price a broader cycle, push[ing] long-end yields materially higher.” But the “primary” concern “remains centered around further geopolitical escalation.”


So much mortgage and other fraud would be “uncovered” if this turns out to be a broader cycle.
What happens to stocks if the US tries to wipe out Iran?
The models don’t care about news until or unless it moves an indicator like volatility or with some models interest rates or less important things.
Many or most of the old models were, thus, market laggards except when things got really got hairy
A serious question – are the new AI assisted or driven models trained to generate signals from contemporary inputs?? The answer has to be Of Course.
Federal budget deficit plus debt-fueled AI spend are fiscal stimulus. Watch for these to go negative, first second derivative then first.