

Time and again over the course of what’s destined to be remembered as one of the single worst years for financial assets in modern history, analysts have noted the conspicuous absence of capitulation from “retail” investors.
This is a somewhat ambiguous discussion given there’s no universally agreed definition of a “retail” investor. That term could mean virtually anything. When it’s applied derisively it’s often a reference to the Robinhood crowd or sundry “unsophisticated” homegamers dabbling in day trading and gambling with options — your stereotypical “bagholders.” But it could also mean a Merrill client sitting on a few million in a self-directed account. Or a retiree with a million in a Vanguard brokerage account in addition to her hefty IRA. Or even a semi-retired, bona fide pro like Kevin Muir, of Macro Tourist fame. Really, it could mean anyone without an ISDA.
I generally avoid trying to determine who’s a “retail investor” and who isn’t because on a strict interpretation, virtually everyone is a retail investor. There aren’t many exceptions to that outside of institutions and hedge funds. (Elon Musk isn’t an institution or a hedge fund, but he’s definitely not a retail investor either. The number of Elon Musks in the world is vanishingly small.)
So, when I have this discussion I typically just fall back on EPFR flows. It’s a lazy shortcut, but it captures weekly buying and selling across asset classes and the data for global equity funds is a generic catch-all — not necessarily for “retail” where that’s everywhere and always a derisive reference to someone buying a single share of SPY, but as good a proxy as any for a wholly malleable category.
Global equity funds have taken in a net $173 billion in 2022 ($398 billion to ETFs and $225 billion from mutual funds), nowhere near 2021’s astounding haul, but net buying nevertheless. Flows have turned negative over some windows (e.g., four-week rolling) during the second half, but pick a week at random and you’re just as likely to see an inflow as not on EPFR’s data. Last week, for example, $7.6 billion flowed in (inflows to US stock funds resumed with an $8.9 billion haul). The figures (below, from Goldman and BofA, respectively) show the breakdown.

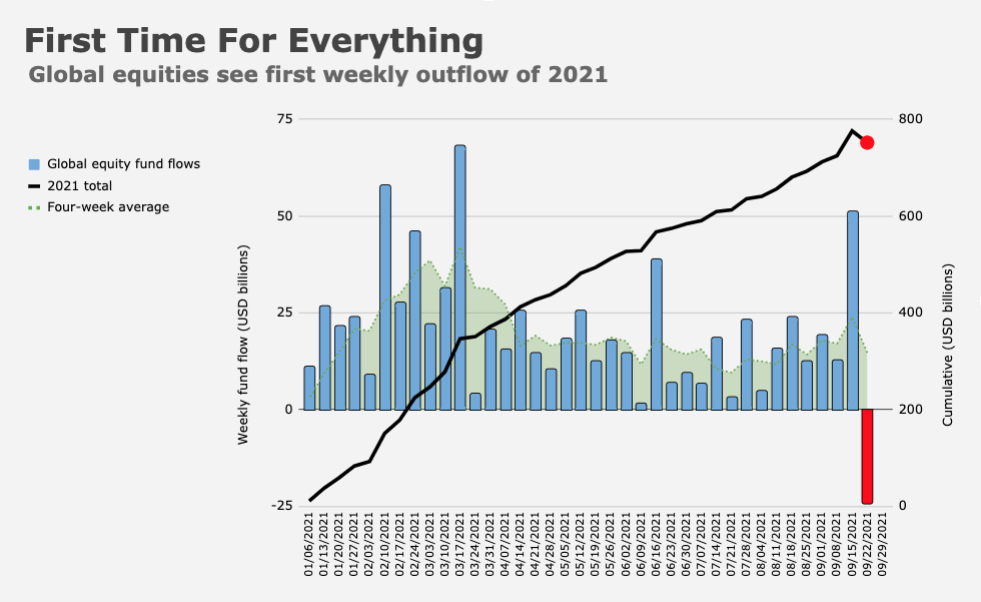
That “high frequency” (as Goldman put it) data on mutual fund and ETF flows suggests “evidence of slowing demand in recent weeks.” That’s a reference to the choppy nature of the flows so far in H2. The flip side of “you’re just as likely to see an inflow as not” (as I wrote above) is that you’re just as likely to see an outflow, as not. That marks a stark contrast to 2021, when net outflows were exceedingly rare. Recall that it wasn’t until late September of last year when global equity funds saw their first net weekly outflow on EPFR’s data.
If you ask Goldman, households (which, depending on the dataset you use, unfortunately includes domestic hedge funds, underscoring the ambiguity mentioned above) are likely to become net sellers going forward. The recent deceleration in weekly ETF and mutual fund flows alongside falling stock prices has already “led to a sharp drop in household equity allocations,” the bank’s David Kostin wrote, on Friday evening.
Fed data suggests household equity allocations did indeed turn lower recently, but as the figure on the left (below) shows, there’s still a long way down.

Historically (where that means recent history) corporates have been the biggest source of equity demand, but the pandemic changed the game. Management teams went into cash preservation mode and then tapped both debt and equity markets for cash. Although net corporate demand recovered smartly in 2021, it was just $29 billion in 2020.
By contrast, householders, emboldened first by stimulus checks and later by the economic recovery and booming stock prices, splurged on $1.2 trillion in equities since 2020 (table on the right, above).
But the tide is starting to turn — or maybe “go out” is more apt. Household demand flipped “slightly negative” in the second quarter, Kostin said. Note that the value of household equities collapsed the most on record during Q2 (figure below).

Over the first half of the year, nearly $11 trillion was wiped away.
Kostin went on to note that “the retail trader component of households has de-risked sharply.” To gauge that, he looked at margin balances (which are down dramatically over the past 12 months) and suggested catastrophic declines in speculative stocks likely mean retail traders “have been largely washed out of the market.”
The bank’s “Retail Favorites” basket has underperformed the broader market by 18 percentage points — at a time when the broader market is down 25%. That’d count as bad performance even for a hedge fund (There’s a joke there. Don’t miss it.)
And yet, despite reduced exposure, “allocations to equities generally remain elevated versus history,” Kostin said. Household equity allocations are still in the 96%ile since World War II, for example. That, Kostin wrote, suggests “further room to cut exposure should the macro environment continue to deteriorate.”
Of course, the macro environment probably will continue to deteriorate. And for Goldman, that raises the odds of net selling from households.
“Rising rates are causing a shift in investor mindsets from TINA (“There Is No Alternative”) to TARA (“There Are Reasonable Alternatives”), indicating a weakening outlook for equity demand going forward,” the bank remarked.
Kostin expects households to sell $100 billion in stocks next year. “Aside from the resurgence of TARA, the macro backdrop points to household selling,” he wrote. Goldman sees the US economy downshifting markedly in 2023, and unemployment rising. “Historically, slowing growth and rising unemployment have coincided with household selling of equities,” the bank said.


For those of us that are dividend investors spread over say 30 to 50 stocks, baby bonds, ETFs etc. as the prices go down the yields go up. So far, the dividends just keep coming. Do we keep on reinvesting the dividends to take advantage of the higher yields or sell and be stuck with FOMO?
Eventually the market will turn around. We haven’t missed any meals yet so not panicking.
For the last 15 years I have reinvested 50-75% of my investment earnings in total. I do donate a third of my income annually, but the rest goes back in the market. I’m having my worst year in a couple decades but my investment income is steadily rising, up nearly 10% YoY. Losses are only losses when you realize them by selling. I rarely sell. My plan now is to follow the behavior of the fixed income market. As rates rise I buy new stuff at higher rates and old stuff that has gone down. Nice how this works. First time in several years there has been a supply of discounted bonds. I’m drooling.
]Same strategy here. I’m invested in what I feel are good investments & dividend payers. As the dividends have been rolling in, I’ve been adding to my positions at bargain prices. Sell now? I don’t think so-I’ll hold on, continue collecting my dividends and wait for the market to turn around.