

Big bank earnings continued to roll in on Thursday, with Bank of America stepping up to the plate.
So far, it’s been a story of outsized trading gains and huge loss provisions for the country’s largest financial institutions, as the impact of the coronavirus on consumers and businesses was partially offset by windfalls for fixed income desks and investment bankers.
The tale was broadly similar for Bank of America, which reported a $4 billion reserve build, after a $3.6 billion build in Q1. Q2’s provision expense was $5.1 billion, up $400 million from the first quarter. The reserve build is, of course, “primarily due to the weaker economic outlook related to COVID-19”, the bank says.

Commercial net charge-offs rose sharply to $412 million from $250 million, while consumer net charge-offs fell to the lowest since the third quarter of 2019.
The total allowance for credit losses has more than doubled YTD, the bank notes, to $21.1 billion.

“In the most tumultuous period since the Great Depression, we delivered for our clients, our employees, our communities and our shareholders”, Brian Moynihan remarked. “Strong capital markets results provided an important counterbalance to the COVID-19-related impacts on our Consumer business”.
Yes, “an important counterbalance” indeed. Specifically, FICC revenue of $3.2 billion rose 50%, thanks to “strong results across credit-related products, especially in the Americas, as the market rebounded after the March selloff, as well as a robust performance from macro products due to solid market-making conditions”, BofA says. Consensus was looking for $2.57 billion, so this is a beat.
In equities, BofA missed, though. Trading revenue there was $1.23 billion, just short of the $1.25 billion the market expected. The bank notes strength in cash and client financing, partially offset by a weaker performance in derivatives.
Overall, trading revenue of $4.4 billion looks like a beat (consensus expected $3.83 billion), but not the kind of blockbuster we got from JPMorgan and, especially, Goldman.
On the headline numbers, BofA reported net revenue of $22.33 billion, down 3.3% YoY. EPS was a beat at $0.37 versus the $0.25 the market expected. Net income plunged thanks to the reserve build.
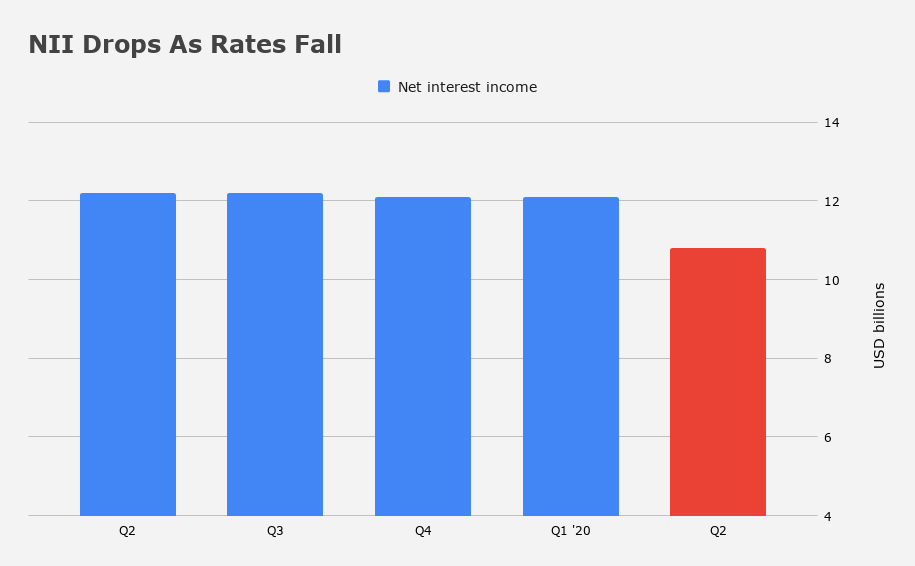
Net interest income dropped 11% (lower rates), a decline that was only partially offset by loan and deposit growth. Noninterest income rose 5% (you can thank capital markets).
Deposits rose 21% during the quarter, to $1.7 trillion. Average deposits in Consumer grew 15% YoY.
BofA sums up the situation for banks’ consumer businesses in just a few lines. “[A] weaker economic outlook related to COVID-19 drove a $2.2 billion reserve build [in consumer banking], lower interest rates drove NII down [and] client activity and fee waivers drove non-interest income lower”.
There you go. It doesn’t get much clearer than that.
Combined credit/debit card spend in Consumer dropped 11% from the same period last year.
The slide deck has a useful update on trends in consumer and small business payments. “On a YoY basis, total payments were down 36% at their lowest point during [the second quarter], but improved and were down less than 10% by the end of the quarter”, the bank notes, adding that “in the last three weeks of June, YoY debit spending was up 10% on average, and continued at this higher level into July due to 4th of July holiday momentum”.

One wonders if that momentum will continue given new lockdowns and reinstated virus containment protocols across states. “By the week ending June 28th, deferral requests had declined 98% from their peak in early April and have remained at this low level”, the bank notes.
Ultimately, it’s hard to find much to get excited about in BofA’s results. The FICC beat is nice, but that’s not really the focus here. Spending is lower, NII is lower, loss provisions are huge, and the outlook is uncertain.
That’s not a great mix, although I suppose things could have been worse, all things considered.
Finally, in the interest of giving you a snapshot of how things have evolved this year, the figure (below) shows provisions across banks in the second quarter, how they compare to Q1, and also how they stack up to “normal” times.


